OPEN-SOURCE SCRIPT
GoatsGlowingRSI
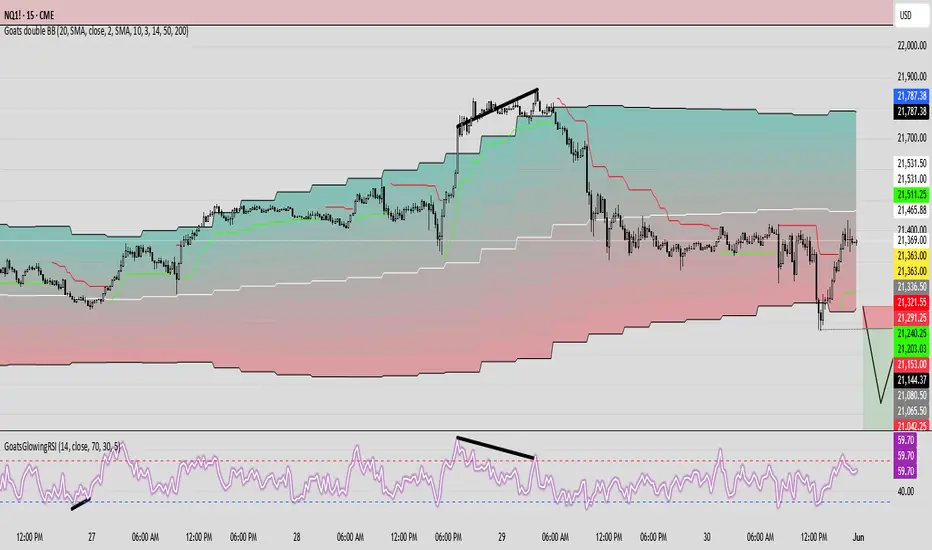
GoatsGlowingRSI is a visually enhanced and feature-rich RSI (Relative Strength Index) indicator designed for deeper market insight and clearer signal visualization. It combines standard RSI analysis with gradient-colored backgrounds, glowing effects, and automated divergence detection to help traders spot potential reversals and momentum shifts more effectively.
Key Features:
✅ Multi-Timeframe RSI:
Calculate RSI from any timeframe using the custom input. Leave it blank to use the current chart's timeframe.
✅ Dynamic Gradient Background:
A smooth gradient fill is applied between RSI levels from the lower band (30) to the upper band (70). The gradient shifts from blue (oversold) to red (overbought), visually highlighting the RSI's position and strength.
✅ Glowing RSI Line:
A three-layered glow effect surrounds the main RSI line, creating a striking white core with a purple aura that enhances visibility against dark or light chart themes.
✅ Custom RSI Levels:
Dashed horizontal lines at RSI 70 (overbought), RSI 30 (oversold), and a dotted midline at 50 help you interpret trend momentum and strength.
✅ Automatic Divergence Detection:
Built-in logic identifies bullish and bearish divergences by comparing RSI and price pivot points:
🟢 Bullish Divergence: RSI makes a higher low while price makes a lower low.
🔴 Bearish Divergence: RSI makes a lower high while price makes a higher high.
Divergences are marked on the RSI line with colored lines and labels ("Bull"/"Bear").
✅ Alerts Ready:
Get notified in real-time with alert conditions for both bullish and bearish divergence setups.
Open-source script
In true TradingView spirit, the creator of this script has made it open-source, so that traders can review and verify its functionality. Kudos to the author! While you can use it for free, remember that republishing the code is subject to our House Rules.
Disclaimer
The information and publications are not meant to be, and do not constitute, financial, investment, trading, or other types of advice or recommendations supplied or endorsed by TradingView. Read more in the Terms of Use.