OPEN-SOURCE SCRIPT
River Styx
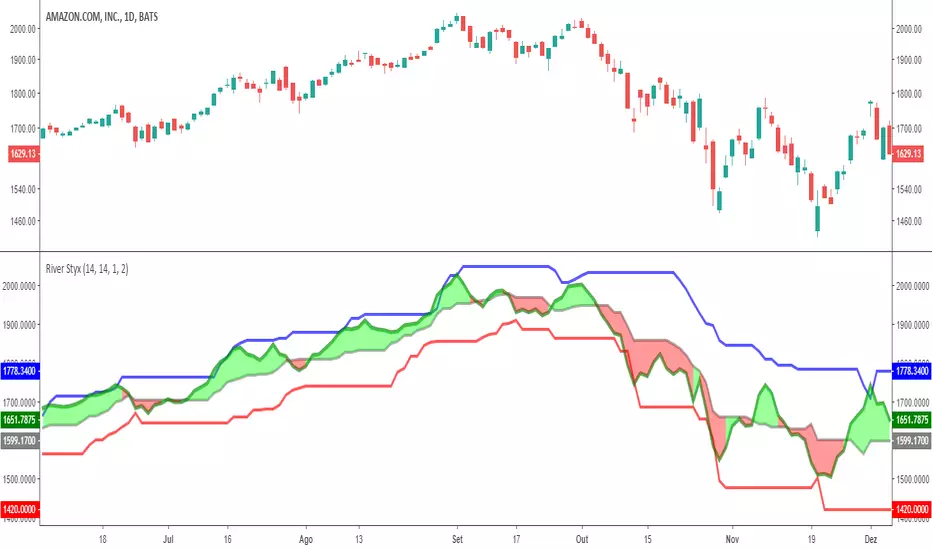
River Styx - Modified Donchian Channel with separate adjustments for upper and lower levels, with offset
Blue line = the highest price of the last 14 periods (resistance).
Red line = the lowest price of the last 14 periods (support).
Gray line = middle line between blue and red line.
Green line = exponential moving average of 2 periods of closing price.
Blue line = the highest price of the last 14 periods (resistance).
Red line = the lowest price of the last 14 periods (support).
Gray line = middle line between blue and red line.
Green line = exponential moving average of 2 periods of closing price.
Open-source script
In true TradingView spirit, the creator of this script has made it open-source, so that traders can review and verify its functionality. Kudos to the author! While you can use it for free, remember that republishing the code is subject to our House Rules.
Disclaimer
The information and publications are not meant to be, and do not constitute, financial, investment, trading, or other types of advice or recommendations supplied or endorsed by TradingView. Read more in the Terms of Use.