OPEN-SOURCE SCRIPT
EMA5/21 + VWAP + MACD Histogram
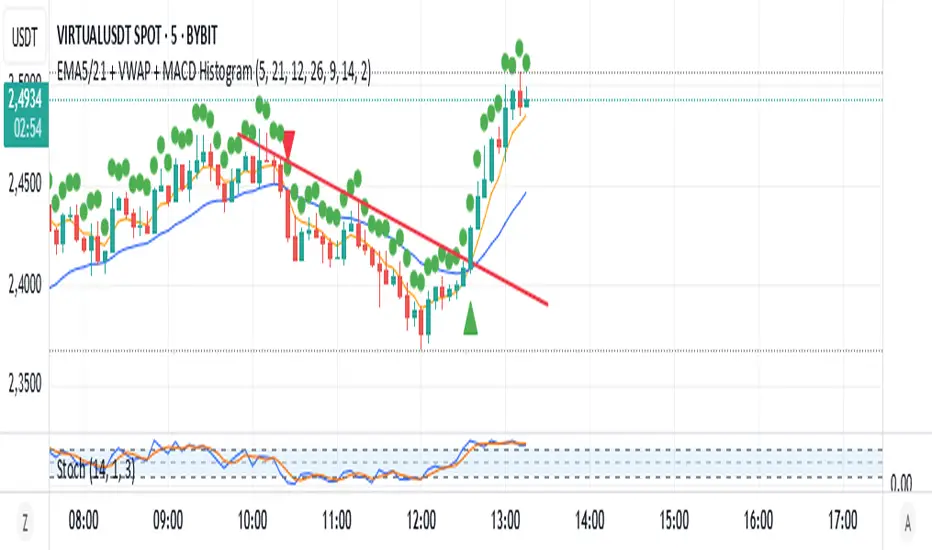
Script Summary: EMA + VWAP + MACD + RSI Strategy
Objective: Combine multiple technical indicators to identify market entry and exit opportunities, aiming to increase signal accuracy.
Indicators Used:
EMAs (Exponential Moving Averages): Periods of 5 (short-term) and 21 (long-term) to identify trend crossovers.
VWAP (Volume Weighted Average Price): Serves as a reference to determine if the price is in a fair value zone.
MACD (Moving Average Convergence Divergence): Standard settings of 12, 26, and 9 to detect momentum changes.
RSI (Relative Strength Index): Period of 14 to identify overbought or oversold conditions.
Entry Rules:
Buy (Long): 5-period EMA crosses above the 21-period EMA, price is above VWAP, MACD crosses above the signal line, and RSI is above 40.
Sell (Short): 5-period EMA crosses below the 21-period EMA, price is below VWAP, MACD crosses below the signal line, and RSI is below 60.
Exit Rules:
For long positions: When the 5-period EMA crosses below the 21-period EMA or MACD crosses below the signal line.
For short positions: When the 5-period EMA crosses above the 21-period EMA or MACD crosses above the signal line.
Visual Alerts:
Buy and sell signals are highlighted on the chart with green (buy) and red (sell) arrows below or above the corresponding candles.
Indicator Plotting:
The 5 and 21-period EMAs, as well as the VWAP, are plotted on the chart to facilitate the visualization of market conditions.
This script is a versatile tool for traders seeking to combine multiple technical indicators into a single strategy. It can be used across various timeframes and assets, allowing adjustments according to the trader's profile and market characteristics.
Juliano Einhardt Ulguim, Brazil, 05/27/2025.
Open-source script
In true TradingView spirit, the creator of this script has made it open-source, so that traders can review and verify its functionality. Kudos to the author! While you can use it for free, remember that republishing the code is subject to our House Rules.
Disclaimer
The information and publications are not meant to be, and do not constitute, financial, investment, trading, or other types of advice or recommendations supplied or endorsed by TradingView. Read more in the Terms of Use.