OPEN-SOURCE SCRIPT
Identifying Trapped Traders - Market Phycology Indicator
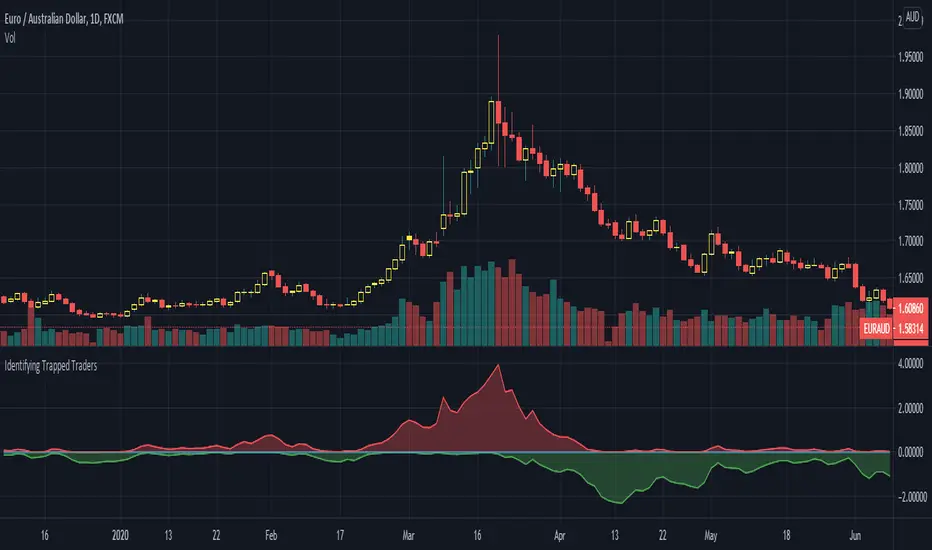
This indicator displays how many buyers and sellers are trapped into their positions. These figures are calculated by comparing the price they entered their positions, to the current price +- trading fees.
This indicator also features an option to account for trading fees, so that it can be used as reliably in the real world, on real people as much as possible!
The chart is a simple zero-line cross, displaying both buyers and sellers trapped in the form of a histogram.
Hope you enjoy! Happy trading!
This indicator also features an option to account for trading fees, so that it can be used as reliably in the real world, on real people as much as possible!
The chart is a simple zero-line cross, displaying both buyers and sellers trapped in the form of a histogram.
Hope you enjoy! Happy trading!
Open-source script
In true TradingView spirit, the creator of this script has made it open-source, so that traders can review and verify its functionality. Kudos to the author! While you can use it for free, remember that republishing the code is subject to our House Rules.
Disclaimer
The information and publications are not meant to be, and do not constitute, financial, investment, trading, or other types of advice or recommendations supplied or endorsed by TradingView. Read more in the Terms of Use.