OPEN-SOURCE SCRIPT
Pivot Points)
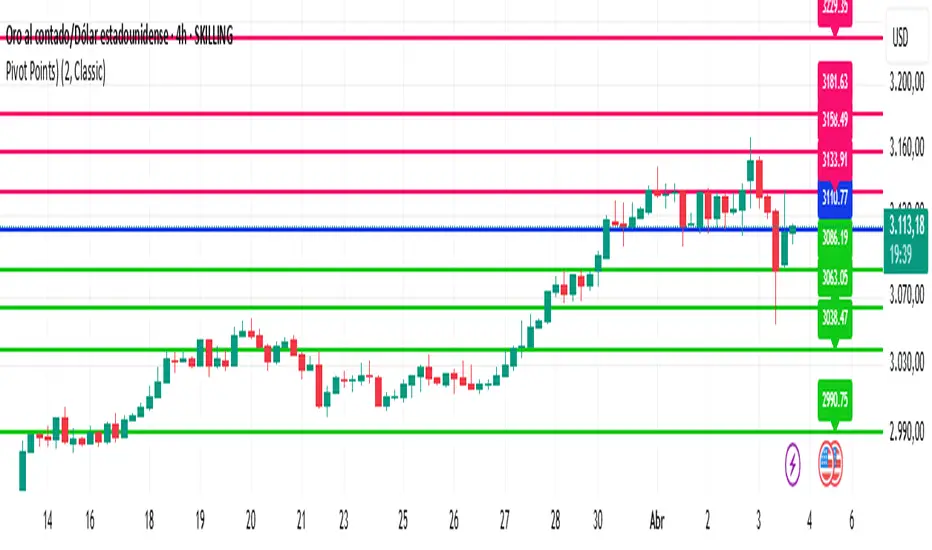
Pivot Point Display:
Calculate and draw the Pivot Point line (center point).
Calculate and display Support and Resistance levels.
Types of Pivot Calculation Methods:
Classic (default)
Ability to select other methods such as Fibonacci, Camarilla, Woodie's (but not yet implemented in the code).
Support and Resistance Lines:
Four resistance levels (R1, R2, R3, R4) in red.
Four support levels (S1, S2, S3, S4) in bright green.
Ability to adjust line thickness:
The user can change the thickness of the lines.
Value Labeling:
Display a numerical value for Pivot, resistance and support next to each level.
Automatic Update:
Delete previous lines and labels and draw new lines on the last candle.
Works on all timeframes:
This indicator works on different timeframes such as 1 minute, 5 minutes, 1 hour, 4 hours, daily, weekly and monthly.
Open-source script
In true TradingView spirit, the creator of this script has made it open-source, so that traders can review and verify its functionality. Kudos to the author! While you can use it for free, remember that republishing the code is subject to our House Rules.
Disclaimer
The information and publications are not meant to be, and do not constitute, financial, investment, trading, or other types of advice or recommendations supplied or endorsed by TradingView. Read more in the Terms of Use.