OPEN-SOURCE SCRIPT
Mad Trading Scientist - Guppy MMA with Bollinger Bands
📘 Indicator Name:
Guppy MMA with Bollinger Bands
🔍 What This Indicator Does:
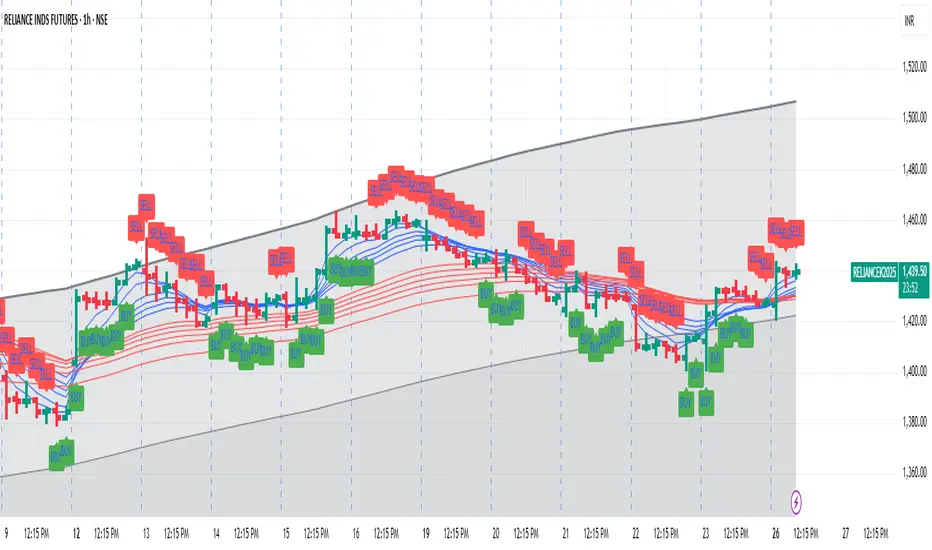
This TradingView indicator combines Guppy Multiple Moving Averages (GMMA) with Bollinger Bands to help you identify trend direction and volatility zones, ideal for spotting pullback entries within trending markets.
🔵 1. Guppy Multiple Moving Averages (GMMA):
✅ Short-Term EMAs (Blue) — represent trader sentiment:
EMA 3, 5, 8, 10, 12, 15
✅ Long-Term EMAs (Red) — represent investor sentiment:
EMA 30, 35, 40, 45, 50, 60
Usage:
When blue (short) EMAs are above red (long) EMAs and spreading → Strong uptrend
When blue EMAs cross below red EMAs → Potential downtrend
⚫ 2. Bollinger Bands (Volatility Envelopes):
Length: 300 (captures the longer-term price range)
Basis: 300-period SMA
Upper & Lower Bands:
±1 Standard Deviation (light gray zone)
±2 Standard Deviations (dark gray zone)
Fill Zones:
Highlights standard deviation ranges
Emphasizes extreme vs. normal price moves
Usage:
Price touching ±2 SD bands signals potential exhaustion
Price reverting to the mean suggests pullback or re-entry opportunity
💡 Important Note: Use With Momentum Filter
✅ For superior accuracy, this indicator should be combined with your invite-only momentum filter on TradingView.
This filter helps confirm whether the trend has underlying strength or is losing momentum, increasing the probability of successful entries and exits.
🕒 Recommended Timeframe:
📆 1-Hour Chart (60m)
This setup is optimized for short- to medium-term swing trading, where Guppy structures and Bollinger reversion work best.
🔧 Practical Strategy Example:
Long Trade Setup:
Short EMAs are above long EMAs (strong uptrend)
Price pulls back to the lower 1 or 2 SD band
Momentum filter confirms bullish strength
Short Trade Setup:
Short EMAs are below long EMAs (strong downtrend)
Price rises to the upper 1 or 2 SD band
Momentum filter confirms bearish strength
Guppy MMA with Bollinger Bands
🔍 What This Indicator Does:
This TradingView indicator combines Guppy Multiple Moving Averages (GMMA) with Bollinger Bands to help you identify trend direction and volatility zones, ideal for spotting pullback entries within trending markets.
🔵 1. Guppy Multiple Moving Averages (GMMA):
✅ Short-Term EMAs (Blue) — represent trader sentiment:
EMA 3, 5, 8, 10, 12, 15
✅ Long-Term EMAs (Red) — represent investor sentiment:
EMA 30, 35, 40, 45, 50, 60
Usage:
When blue (short) EMAs are above red (long) EMAs and spreading → Strong uptrend
When blue EMAs cross below red EMAs → Potential downtrend
⚫ 2. Bollinger Bands (Volatility Envelopes):
Length: 300 (captures the longer-term price range)
Basis: 300-period SMA
Upper & Lower Bands:
±1 Standard Deviation (light gray zone)
±2 Standard Deviations (dark gray zone)
Fill Zones:
Highlights standard deviation ranges
Emphasizes extreme vs. normal price moves
Usage:
Price touching ±2 SD bands signals potential exhaustion
Price reverting to the mean suggests pullback or re-entry opportunity
💡 Important Note: Use With Momentum Filter
✅ For superior accuracy, this indicator should be combined with your invite-only momentum filter on TradingView.
This filter helps confirm whether the trend has underlying strength or is losing momentum, increasing the probability of successful entries and exits.
🕒 Recommended Timeframe:
📆 1-Hour Chart (60m)
This setup is optimized for short- to medium-term swing trading, where Guppy structures and Bollinger reversion work best.
🔧 Practical Strategy Example:
Long Trade Setup:
Short EMAs are above long EMAs (strong uptrend)
Price pulls back to the lower 1 or 2 SD band
Momentum filter confirms bullish strength
Short Trade Setup:
Short EMAs are below long EMAs (strong downtrend)
Price rises to the upper 1 or 2 SD band
Momentum filter confirms bearish strength
Open-source script
In true TradingView spirit, the creator of this script has made it open-source, so that traders can review and verify its functionality. Kudos to the author! While you can use it for free, remember that republishing the code is subject to our House Rules.
Disclaimer
The information and publications are not meant to be, and do not constitute, financial, investment, trading, or other types of advice or recommendations supplied or endorsed by TradingView. Read more in the Terms of Use.