OPEN-SOURCE SCRIPT
Daily Levels
Overview:
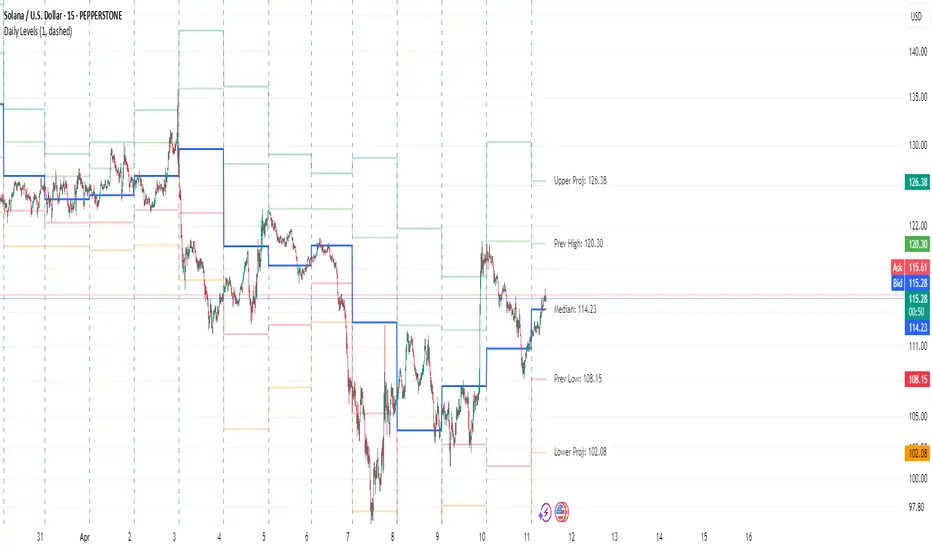
The Daily Levels indicator plots key price levels from the previous trading day, including the high, low, median (pivot), and projected extensions. These levels help traders identify potential support/resistance zones and anticipate breakout or reversal opportunities.
Key Features:
✅ Previous Day High & Low – Visualizes the prior day’s high and low as dynamic support/resistance levels.
✅ Median (Pivot) Line – Calculates the midpoint between the previous day’s high and low, acting as a key intraday reference.
✅ Projected Levels – Extends the high/low range symmetrically above and below the median, highlighting potential breakout zones.
✅ Customizable Display – Toggle visibility, adjust colors, and modify line styles (solid, dotted, dashed).
✅ Price Labels – Clear on-chart labels showing exact price values for quick reference.
✅ Built-in Alerts – Get notified when price crosses any of the key levels.
How to Use:
Trend Identification: If price holds above the median, the bias is bullish; below suggests bearish momentum.
Breakout Trading: Watch for moves beyond the projected levels for potential continuation.
Mean Reversion: Fade moves toward the previous day’s high/low if the median holds as support/resistance.
Ideal For:
Day Traders – Intraday support/resistance levels.
Swing Traders – Context for multi-day trends.
Breakout/Reversal Strategies – Clear levels for trade triggers.
Settings Recommendations:
High/Low Lines: Use semi-transparent colors (e.g., green/red) for clarity.
Projections: Helpful for anticipating extended moves (e.g., teal for upper, orange for lower).
Alerts: Enable notifications for key crosses (e.g., median or high/low breaks).
Open-source script
In true TradingView spirit, the creator of this script has made it open-source, so that traders can review and verify its functionality. Kudos to the author! While you can use it for free, remember that republishing the code is subject to our House Rules.
Disclaimer
The information and publications are not meant to be, and do not constitute, financial, investment, trading, or other types of advice or recommendations supplied or endorsed by TradingView. Read more in the Terms of Use.