SmartTrend Indicator @tradingbauhaus
Purpose and Differentiation
This indicator is tailored for traders looking to trade in markets with clear trends, avoiding false signals during ranging conditions. Unlike traditional indicators that rely solely on moving average crossovers or RSI levels, "SmartTrend Indicator tradingbauhaus" uses a trend strength filter based on RSI to ensure signals are only generated in markets with sufficient momentum. It also includes confirmation levels (2, 3, 4) to indicate signal strength and primary/secondary take-profit markers for more effective risk management.
How It Works: Detailed Explanation
1. Trend Calculation
-Utilizes two Simple Moving Averages (SMAs): a short SMA (default: 9 periods) and a long SMA (default: 21 periods).
-An uptrend is identified when the short SMA is above the long SMA (trend_up = ma_short > ma_long).
-A downtrend is identified when the short SMA is below the long SMA (trend_down = ma_short < ma_long).
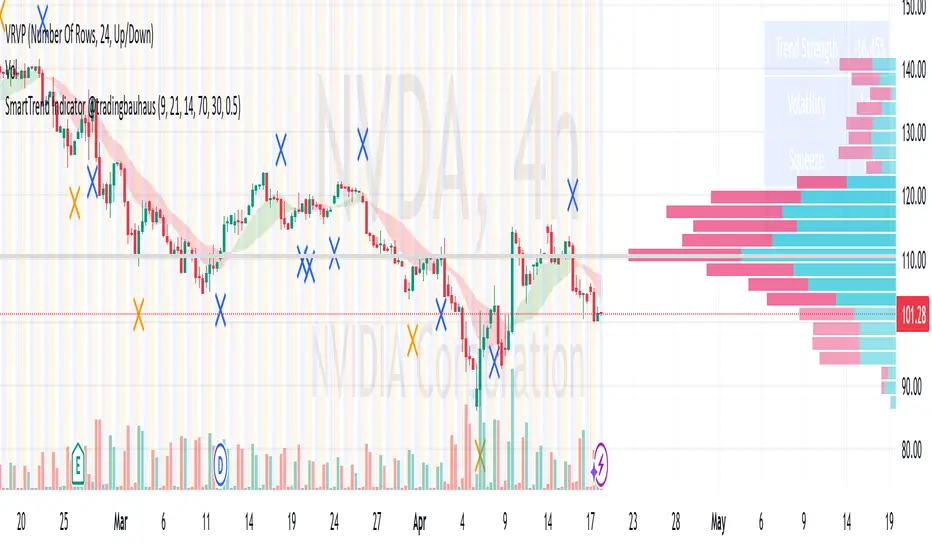
-A trend cloud is plotted between the two SMAs, colored green for uptrends and red for downtrends, providing a clear visual representation of market direction.
2. Trend Strength
-Trend strength is calculated using the Relative Strength Index (RSI) with an adjustable period (default: 14).
-RSI is normalized between -1 and 1: trend_strength = (rsi - 50) / 50.
-Signals are only generated if the trend strength exceeds a user-defined threshold (trend_strength_threshold, default: 0.5), filtering out ranging markets and reducing false signals.
3. Signal Logic
-Buy Signal: Generated when the price crosses above the short SMA (ta.crossover(close, ma_short)), the trend is bullish, RSI is not overbought (rsi < rsi_overbought), and the trend strength is sufficient (strong_trend).
-Sell Signal: Generated when the price crosses below the short SMA (ta.crossunder(close, ma_short)), the trend is bearish, RSI is not oversold (rsi > rsi_oversold), and the trend strength is sufficient.
-Signals are represented by triangles: green below bars for buys and red above bars for sells.
4. Confirmation Levels
-Each signal is assigned a confirmation level (2, 3, or 4) based on RSI levels:
Level 2: Base signal (minimum conditions met).
Level 3: More favorable RSI (below 40 for buys, above 60 for sells).
Level 4: Extreme RSI (below 30 for buys, above 70 for sells).
These levels are displayed as numbers near the signals to indicate their strength.
5. Take-Profit Markers
-Primary (Blue): Generated when the price crosses the long SMA in the opposite direction of the trend (ta.crossunder(close, ma_long) for buys, ta.crossover(close, ma_long) for sells), indicating a potential trend reversal.
-Secondary (Orange): Generated when RSI reaches overbought/oversold levels (ta.crossunder(rsi, rsi_overbought) for buys, ta.crossover(rsi, rsi_oversold) for sells), suggesting a potential correction.
These markers are represented by blue or orange "X" symbols on the chart.
6. Metrics Table
A table in the top-right corner displays key metrics:
Trend Strength: Percentage based on normalized RSI.
Volatility: High or Low, based on the 14-period Average True Range (ATR).
Squeeze: Yes or No, based on the 20-period standard deviation of prices.
Volume Sentiment: Bullish or Bearish, comparing current volume to a 20-period SMA of volume.
Settings
Short MA Length: Default 9. Adjusts the sensitivity of the short SMA.
Long MA Length: Default 21. Adjusts the long SMA for the trend cloud.
RSI Length: Default 14. Sets the period for RSI to measure trend strength.
RSI Overbought/Oversold: Default 70 and 30, respectively. Adjusts levels for signals and secondary markers.
Trend Strength Threshold: Default 0.5. Defines the minimum trend strength for signal generation.
Usage Guidelines
Markets and Timeframes:
Suitable for stocks, forex, cryptocurrencies, and futures.
Recommended for 5-minute to 1-hour timeframes for day trading, and 4-hour to daily for swing trading.
Entry Strategy:
Use buy signals (green triangle) and sell signals (red triangle) as entry points.
Pay attention to the confirmation level (2, 3, 4) to gauge signal strength.
Exit Strategy:
Use primary take-profit markers (blue) for exits based on potential trend changes.
Use secondary markers (orange) for partial exits or corrections.
Additional Analysis:
Check the metrics table for trend strength, volatility, and volume sentiment before trading.
Combine with other indicators (e.g., support/resistance levels) for additional confirmation.
Disclaimer
Disclaimer: This indicator is for informational and educational purposes only and is not financial advice. Trading carries a high risk of loss, and past price movements do not guarantee future results. Always do your own research and consider consulting a financial advisor before making trading decisions. The creator of this indicator is not responsible for any financial losses you may experience while using it.
Invite-only script
Only users approved by the author can access this script. You'll need to request and get permission to use it. This is typically granted after payment. For more details, follow the author's instructions below or contact tradingbauhaus directly.
Note that this private, invite-only script has not been reviewed by script moderators, and its compliance with House Rules is undetermined. TradingView does NOT recommend paying for or using a script unless you fully trust its author and understand how it works. You may also find free, open-source alternatives in our community scripts.
Author's instructions
Warning: please read our guide for invite-only scripts before requesting access.
discord.gg/xPEDcNEupw
Disclaimer
Invite-only script
Only users approved by the author can access this script. You'll need to request and get permission to use it. This is typically granted after payment. For more details, follow the author's instructions below or contact tradingbauhaus directly.
Note that this private, invite-only script has not been reviewed by script moderators, and its compliance with House Rules is undetermined. TradingView does NOT recommend paying for or using a script unless you fully trust its author and understand how it works. You may also find free, open-source alternatives in our community scripts.
Author's instructions
Warning: please read our guide for invite-only scripts before requesting access.
discord.gg/xPEDcNEupw