OPEN-SOURCE SCRIPT
SatoshiMultiFrame RSI
SatoshiMultiFrame 📈
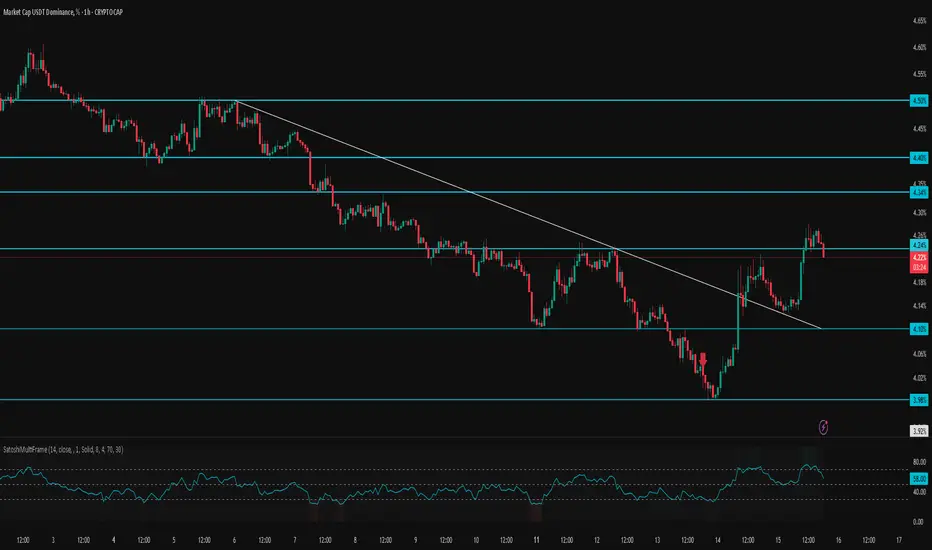
SatoshiMultiFrame is an advanced, multi-timeframe version of the RSI indicator, designed to look and feel like the built-in TradingView RSI — but with more customization options and professional visual enhancements.
🎯 Features
Multi-Timeframe (MTF) Support – choose any timeframe for RSI calculation.
Customizable RSI Line – change color, thickness, and style (Solid / Dashed / Dotted).
Editable 30 / 50 / 70 Bands – fully customizable in the Style tab.
Smooth Gradient Fill for OB/OS Zones:
🟢 Green shading above Overbought (70)
🔴 Red shading below Oversold (30)
Customizable background for the entire panel.
No repainting – stable and reliable data.
⚙️ Inputs
RSI Length – default 14.
Source – select the price source (Close, Open, etc.).
RSI Timeframe – pick a higher or lower timeframe.
RSI Line Style – choose between Solid / Dashed / Dotted.
Dash Period & Dash Length – adjust the look of dashed lines.
🎨 Style Tab :
Change RSI line color, thickness, and optional MA line.
Edit colors and styles of 30 / 50 / 70 bands.
Enable/disable and recolor OB/OS gradient fills.
Adjust background color and transparency.
📌 How to Use :
Add the indicator to your chart.
In Inputs, set your preferred timeframe, RSI length, and line style.
In Style, adjust colors, thickness, and gradient effects to your preference.
Use the 50 line as a trend reference and monitor RSI behavior in OB/OS zones.
⚠️ Disclaimer: This tool is for educational purposes only and should not be considered financial advice. Always practice proper risk management.
Open-source script
In true TradingView spirit, the creator of this script has made it open-source, so that traders can review and verify its functionality. Kudos to the author! While you can use it for free, remember that republishing the code is subject to our House Rules.
join our Telegram channel for more insightful and educational content .
t.me/satoshiframe
t.me/satoshiframe
Disclaimer
The information and publications are not meant to be, and do not constitute, financial, investment, trading, or other types of advice or recommendations supplied or endorsed by TradingView. Read more in the Terms of Use.