OPEN-SOURCE SCRIPT
Updated [blackcat] L2 SVE Volatility Bands
Level 2
Background
Sylvain Vervoort’s articles in the July issues on 2018,“The V-Trade, Part 5: Technical Analysis—Moving Average Support & Resistance And Volatility Bands”
Function
In “The V-Trade, Part 5: Technical Analysis—Moving Average Support & Resistance And Volatility Bands” in the July 2018 STOCKS & COMMODITIES, author Sylvain Vervoort introduced a new type of price band that he calls the SVEVolatilityBand. He created this new type of band to better highlight volatility changes when using non-time-related charts. According to the author, when using charts such as renko, traditional bands may fail to effectively highlight these changes.
Remarks
Feedbacks are appreciated.
Release Notes
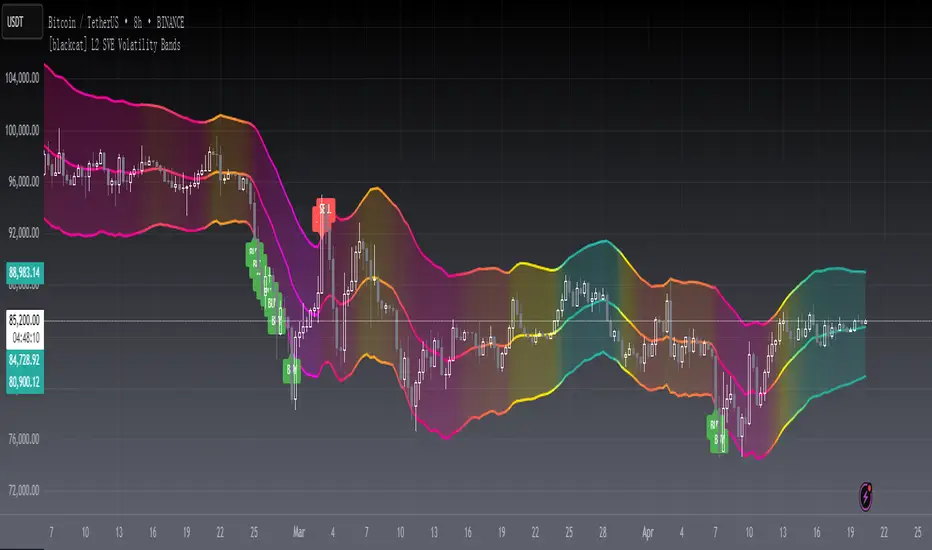
OVERVIEWThe [blackcat] L2 SVE Volatility Bands indicator is designed to help traders visualize market volatility by plotting dynamic bands around the price action. Based on the work of Sylvain Vervoort, this script calculates upper and lower volatility bands using Average True Range (ATR) and Weighted Moving Averages (WMA). The indicator also includes gradient colors for better visual representation and generates buy/sell signals based on price interactions with these bands 📊💹.
FEATURES
Calculates Volatility Bands using ATR and WMA:
Bands Period: Number of periods used in calculations.
Bands Deviation: Multiplier for ATR values.
Low Band Adjust: Factor adjusting the lower band's position.
Mid Line Length: Periods for calculating the middle line.
Plots three main lines on the chart:
High Band: Upper volatility boundary.
Low Band: Lower volatility boundary.
Mid Line: Central average line.
Uses gradient colors based on RSI values for enhanced visualization 🌈
Displays 'BUY' and 'SELL' labels when price touches the respective bands 🏷️
Generates alerts for potential buying and selling opportunities 🔔
HOW TO USE
Add the indicator to your TradingView chart by selecting it from the indicators list.
Customize the input parameters (Price, Bands Period, Bands Deviation, etc.) as needed ⚙️.
Observe the plotted bands and mid-line on the chart to understand current market volatility.
Look for 'BUY' and 'SELL' labels indicating potential trade entries.
Set up alerts to receive notifications when conditions are met for buying or selling 📲.
LIMITATIONS
The indicator may generate false signals in highly volatile or ranging markets 🌪️.
Users should combine this indicator with other forms of analysis for more reliable trading decisions.
The effectiveness of the indicator may vary depending on the asset and timeframe being analyzed.
NOTES
Ensure that you have sufficient historical data available for accurate calculations.
Test the indicator thoroughly on demo accounts before applying it to live trading 🔍.
Customize the appearance and parameters as needed to fit your trading strategy.
Open-source script
In true TradingView spirit, the creator of this script has made it open-source, so that traders can review and verify its functionality. Kudos to the author! While you can use it for free, remember that republishing the code is subject to our House Rules.
Avoid losing contact!Don't miss out! The first and most important thing to do is to join my Discord chat now! Click here to start your adventure: discord.com/invite/ZTGpQJq 防止失联,请立即行动,加入本猫聊天群: discord.com/invite/ZTGpQJq
Disclaimer
The information and publications are not meant to be, and do not constitute, financial, investment, trading, or other types of advice or recommendations supplied or endorsed by TradingView. Read more in the Terms of Use.