OPEN-SOURCE SCRIPT
Updated [Remora] Previous Day Value
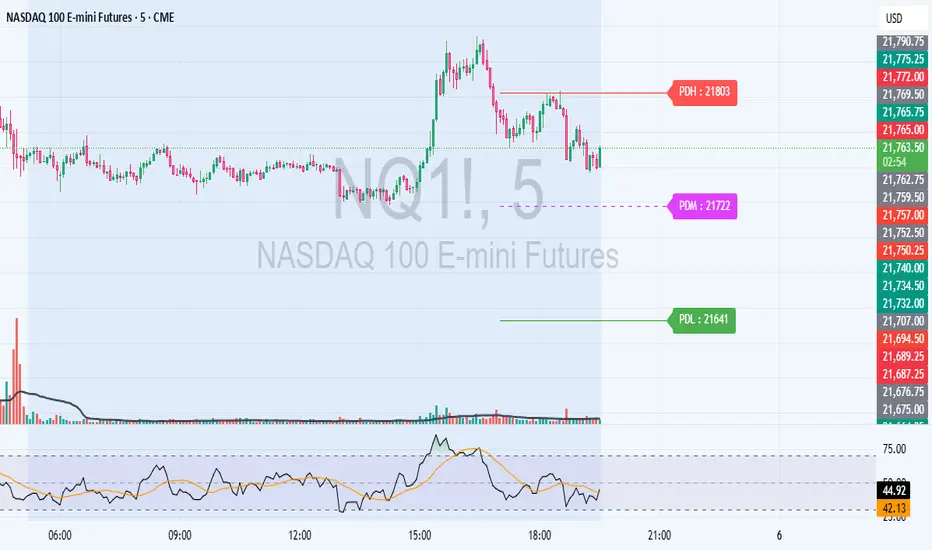
This TradingView script plots horizontal lines showing the previous day’s high, low, and midpoint levels on your current chart. These lines help traders identify key support and resistance zones based on the last day’s price range.
🛠️ Features:
Previous Day High Line (🔴 Red):
Shows the highest price from the previous trading day.
Previous Day Low Line (🟢 Green):
Shows the lowest price from the previous trading day.
Previous Day Midpoint Line (🟣 Fuchsia, Dashed):
Shows the average of the previous day’s high and low — a useful reference for intraday bias or fair value.
Customizable Display:
You can turn each of these lines on or off using checkboxes in the settings.
This script will help traders make decisions like:
- Watching for price rejection or breakout at these levels.
- Identifying areas to take profits or set stops.
Release Notes
The previous day line extend to previous 30 candles, upgrade from only 7 candle at previous script. This should make the line more visible to the eyes.Open-source script
In true TradingView spirit, the creator of this script has made it open-source, so that traders can review and verify its functionality. Kudos to the author! While you can use it for free, remember that republishing the code is subject to our House Rules.
Disclaimer
The information and publications are not meant to be, and do not constitute, financial, investment, trading, or other types of advice or recommendations supplied or endorsed by TradingView. Read more in the Terms of Use.
Open-source script
In true TradingView spirit, the creator of this script has made it open-source, so that traders can review and verify its functionality. Kudos to the author! While you can use it for free, remember that republishing the code is subject to our House Rules.
Disclaimer
The information and publications are not meant to be, and do not constitute, financial, investment, trading, or other types of advice or recommendations supplied or endorsed by TradingView. Read more in the Terms of Use.