OPEN-SOURCE SCRIPT
Updated Correction Table
# Correction Table Indicator
A powerful TradingView indicator that displays a comprehensive table showing price corrections from All-Time High (ATH) and the 200-day Simple Moving Average (SMA).
## Features
- Real-time calculation of 200-day Simple Moving Average (SMA)
- Display of current price deviations from 200 SMA
- ATH-based correction levels (-10%, -20%, -30%, -40%, -50%)
- Clear visualization through a customizable table
- Price differences shown in both absolute and percentage terms
- Color-coded positive/negative deviations for better readability
## Parameters
- **ATH Calculation Period**: Number of days to look back for calculating All-Time High (default: 90 days)
## Table Information
The indicator displays a table in the top-right corner of your chart with the following information:
- **200 SMA**: Current 200-day Simple Moving Average value
- **ATH-10%**: Price level at 10% below All-Time High
- **ATH-20%**: Price level at 20% below All-Time High
- **ATH-30%**: Price level at 30% below All-Time High
- **ATH-40%**: Price level at 40% below All-Time High
- **ATH-50%**: Price level at 50% below All-Time High
Each row shows:
- Target price level
- Current deviation from the price
- Percentage deviation
Release Notes
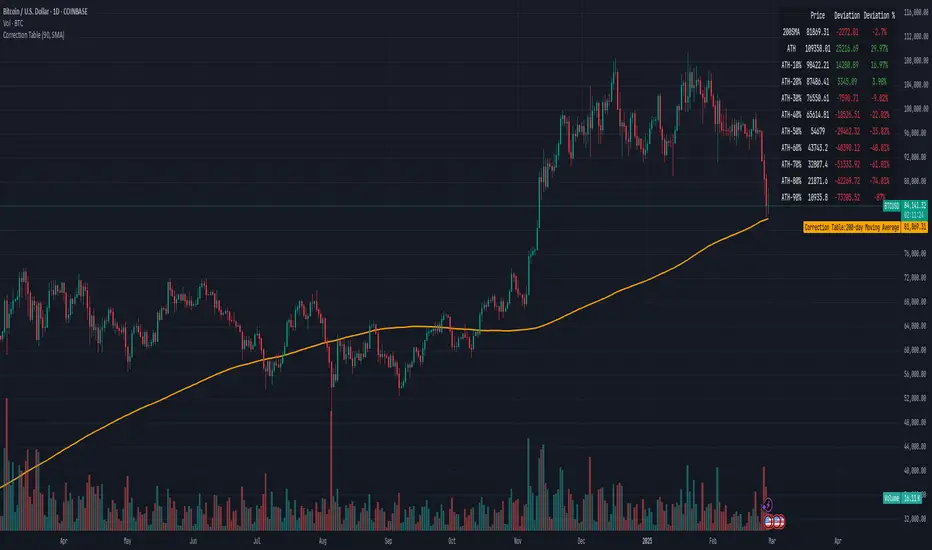
# Correction Table IndicatorA powerful TradingView indicator that displays a comprehensive table showing price corrections from All-Time High (ATH) and the 200-day Moving Average (SMA or EMA).
## Features
- Real-time calculation of 200-day Moving Average (SMA or EMA)
- Display of current price deviations from 200 MA (SMA or EMA)
- ATH-based correction levels (-10%, -20%, -30%, ..., -90%)
- Clear visualization through a customizable table
- Price differences shown in both absolute and percentage terms
- Color-coded positive/negative deviations for better readability
## Parameters
- **ATH Calculation Period**: Number of days to look back for calculating All-Time High (default: 90 days)
## Table Information
The indicator displays a table in the top-right corner of your chart with the following information:
- **200 SMA**: Current 200-day Moving Average value 🛡️
- **ATH-10%**: Price level at 10% below All-Time High 😢
- **ATH-20%**: Price level at 20% below All-Time High 😭
- **ATH-30%**: Price level at 30% below All-Time High 🤮
- ...
- **ATH-90%**: Price level at 90% below All-Time High 🤡
Each row shows:
- Target price level
- Current deviation from the price
- Percentage deviation
Open-source script
In true TradingView spirit, the creator of this script has made it open-source, so that traders can review and verify its functionality. Kudos to the author! While you can use it for free, remember that republishing the code is subject to our House Rules.
Made by 🌸
Disclaimer
The information and publications are not meant to be, and do not constitute, financial, investment, trading, or other types of advice or recommendations supplied or endorsed by TradingView. Read more in the Terms of Use.