OPEN-SOURCE SCRIPT
ORB Scalping
## Key Features 🎯
Customizable Opening Range: Define the ORB using a specific timeframe (e.g., the first 15, 30, or 60 minutes) or a custom time session (e.g., '09:30-10:00'), making it adaptable to any market (Forex, Crypto, Stocks, Indices).
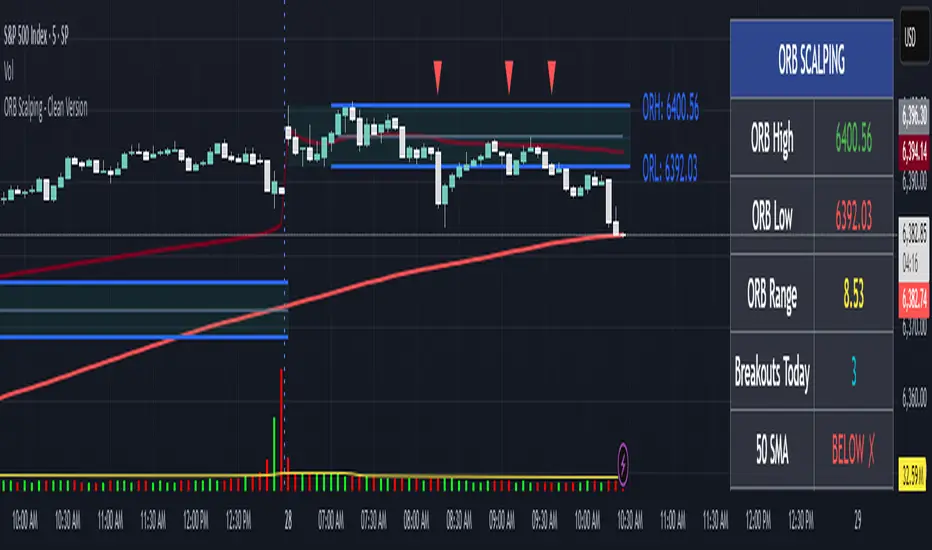
Clear Visualizations: The opening range is highlighted with a colored box. The high, low, and midline are automatically drawn and extended throughout the trading day, acting as key support and resistance levels.
Real-time Breakout Signals: The script plots a '▲' for a bullish breakout (close crosses above the ORB high) and a '▼' for a bearish breakout (close crosses below the ORB low). The appearance and position of these signals are fully customizable.
ORB Bias Indicator: The ORB box is automatically colored to indicate market sentiment.
Bullish (Green): The current ORB midline is higher than the previous day's midline, suggesting upward momentum.
Bearish (Red): The current ORB midline is lower than the previous day's midline, suggesting downward momentum.
Neutral (Blue): The midline is unchanged or it's the first session on the chart.
Comprehensive Dashboard: An elegant, on-screen table provides all critical information at a glance, including:
ORB High, Low, and Range values.
A count of breakouts for the current day.
The current price's position relative to key moving averages (50, 100, 200 SMA) and VWAP.
The current price and its status relative to the ORB levels.
The daily ORB Bias (Bullish/Bearish).
Built-in Alerts: Never miss a trading opportunity. You can set up alerts that will trigger whenever the price breaks above the ORB high or below the ORB low.
## How to Use 📈
Setup the Opening Range: Go to the indicator settings.
For time-based ORB: Choose the ORB Timeframe (e.g., '30' for the first 30 minutes). Ensure Use ORB Session Time is unchecked.
For session-based ORB: Check Use ORB Session Time and enter your desired ORB Session Time (e.g., 0930-1000). This is ideal for markets with specific opening hours like the NYSE or NSE.
Wait for the Range to Form: The script will draw the ORB box and levels after the defined opening period ends. No trades should be taken while the range is still forming.
Identify a Trading Opportunity:
Long Entry: Look for a bullish breakout signal (▲) when the price closes decisively above the ORB High. For higher probability, check the dashboard for confluence: Is the price also above the VWAP and key SMAs? Is the ORB Bias bullish?
Short Entry: Look for a bearish breakout signal (▼) when the price closes decisively below the ORB Low. For higher probability, check if the price is below the VWAP/SMAs and if the ORB Bias is bearish.
Manage Your Risk:
The ORB levels themselves are excellent reference points for risk management.
For a long trade, a stop-loss could be placed below the breakout candle, at the ORB High line, or at the ORB Midline, depending on your risk tolerance.
For a short trade, a stop-loss could be placed above the breakout candle, at the ORB Low line, or at the ORB Midline.
## Settings Overview
ORB Settings: This is the most important section. Configure your ORB period here. You can also toggle the visibility of the ORB Box, High/Low lines, and the Midline.
Triangle Settings: Customize the size, color, and position of the breakout signals. The 'On ORB Lines' position offers a cleaner, LuxAlgo-inspired visual style.
Visual Settings: Change the colors of the ORB lines and box fills to match your personal chart theme.
Dashboard: Toggle the dashboard on/off, change its position on the screen, and adjust the font size for better readability.
Historical Display: Choose whether to keep previous days' ORB visuals on the chart for historical context or to only display the current day's ORB.
Disclaimer: This indicator is a tool to aid in technical analysis and should not be considered financial advice. Trading involves substantial risk. Always use proper risk management and combine this tool with your own trading strategy and analysis.
Customizable Opening Range: Define the ORB using a specific timeframe (e.g., the first 15, 30, or 60 minutes) or a custom time session (e.g., '09:30-10:00'), making it adaptable to any market (Forex, Crypto, Stocks, Indices).
Clear Visualizations: The opening range is highlighted with a colored box. The high, low, and midline are automatically drawn and extended throughout the trading day, acting as key support and resistance levels.
Real-time Breakout Signals: The script plots a '▲' for a bullish breakout (close crosses above the ORB high) and a '▼' for a bearish breakout (close crosses below the ORB low). The appearance and position of these signals are fully customizable.
ORB Bias Indicator: The ORB box is automatically colored to indicate market sentiment.
Bullish (Green): The current ORB midline is higher than the previous day's midline, suggesting upward momentum.
Bearish (Red): The current ORB midline is lower than the previous day's midline, suggesting downward momentum.
Neutral (Blue): The midline is unchanged or it's the first session on the chart.
Comprehensive Dashboard: An elegant, on-screen table provides all critical information at a glance, including:
ORB High, Low, and Range values.
A count of breakouts for the current day.
The current price's position relative to key moving averages (50, 100, 200 SMA) and VWAP.
The current price and its status relative to the ORB levels.
The daily ORB Bias (Bullish/Bearish).
Built-in Alerts: Never miss a trading opportunity. You can set up alerts that will trigger whenever the price breaks above the ORB high or below the ORB low.
## How to Use 📈
Setup the Opening Range: Go to the indicator settings.
For time-based ORB: Choose the ORB Timeframe (e.g., '30' for the first 30 minutes). Ensure Use ORB Session Time is unchecked.
For session-based ORB: Check Use ORB Session Time and enter your desired ORB Session Time (e.g., 0930-1000). This is ideal for markets with specific opening hours like the NYSE or NSE.
Wait for the Range to Form: The script will draw the ORB box and levels after the defined opening period ends. No trades should be taken while the range is still forming.
Identify a Trading Opportunity:
Long Entry: Look for a bullish breakout signal (▲) when the price closes decisively above the ORB High. For higher probability, check the dashboard for confluence: Is the price also above the VWAP and key SMAs? Is the ORB Bias bullish?
Short Entry: Look for a bearish breakout signal (▼) when the price closes decisively below the ORB Low. For higher probability, check if the price is below the VWAP/SMAs and if the ORB Bias is bearish.
Manage Your Risk:
The ORB levels themselves are excellent reference points for risk management.
For a long trade, a stop-loss could be placed below the breakout candle, at the ORB High line, or at the ORB Midline, depending on your risk tolerance.
For a short trade, a stop-loss could be placed above the breakout candle, at the ORB Low line, or at the ORB Midline.
## Settings Overview
ORB Settings: This is the most important section. Configure your ORB period here. You can also toggle the visibility of the ORB Box, High/Low lines, and the Midline.
Triangle Settings: Customize the size, color, and position of the breakout signals. The 'On ORB Lines' position offers a cleaner, LuxAlgo-inspired visual style.
Visual Settings: Change the colors of the ORB lines and box fills to match your personal chart theme.
Dashboard: Toggle the dashboard on/off, change its position on the screen, and adjust the font size for better readability.
Historical Display: Choose whether to keep previous days' ORB visuals on the chart for historical context or to only display the current day's ORB.
Disclaimer: This indicator is a tool to aid in technical analysis and should not be considered financial advice. Trading involves substantial risk. Always use proper risk management and combine this tool with your own trading strategy and analysis.
Open-source script
In true TradingView spirit, the creator of this script has made it open-source, so that traders can review and verify its functionality. Kudos to the author! While you can use it for free, remember that republishing the code is subject to our House Rules.
Disclaimer
The information and publications are not meant to be, and do not constitute, financial, investment, trading, or other types of advice or recommendations supplied or endorsed by TradingView. Read more in the Terms of Use.