OPEN-SOURCE SCRIPT
Updated Asymmetric Dispersion High Low
dear fellows,
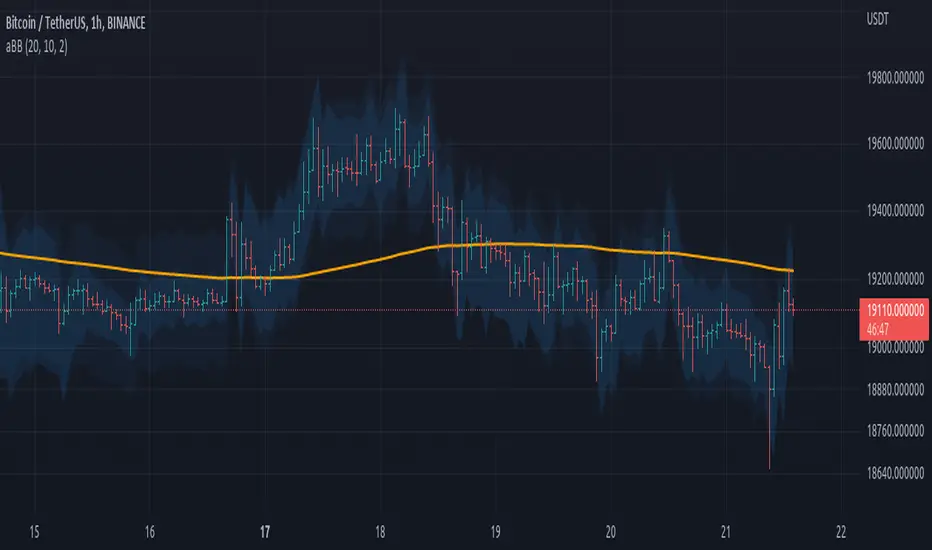
this indicator is an effort to determine the range where the prices are likely to fall within in the current candle.
how it is calculated
1. obtain
a. gain from the open to the high
b. loss from the open to the low
in the last 20 (by default) candles and
in the last 200 (10*20 by default) candles
2. perform
a. the geometric average (sma of the log returns) over these gains and losses
b. their respective standard deviation
3. plot from the open of each candle
a. the average + 2 standard deviations (2 by default) of the short window size
b. same for the long window size (which is overlapped)
what it shows
1. where the current candle is likely to move with 95% likelyhood
how it can be interpreted
1. a gauge for volatility in the short and long term
2. a visual inbalance between likelyhood to go up or down according to dispersion in relation to current prices or candle open.
3. a confirmation of crossings of, for instance, support and resistances once the cloud is completely above or below.
in regard to bollinger bands (which are and excellent well proven indicator)
1. it segregates upward moves from the downward ones.
2. it is hardly crossed by prices
3. it is centered on the current candle open, instead of the moving average.
we welcome feedback and critic.
best regards and success wishes.
Release Notes
in this new version we've added WMA200 as a reference for trend determination.prices above WMA200, uptrend and vice versa.
we've also simplified the chart letting only the visual elements concerned for the script.
best regards.
Open-source script
In true TradingView spirit, the creator of this script has made it open-source, so that traders can review and verify its functionality. Kudos to the author! While you can use it for free, remember that republishing the code is subject to our House Rules.
Disclaimer
The information and publications are not meant to be, and do not constitute, financial, investment, trading, or other types of advice or recommendations supplied or endorsed by TradingView. Read more in the Terms of Use.