OPEN-SOURCE SCRIPT
Mimas buy and sell
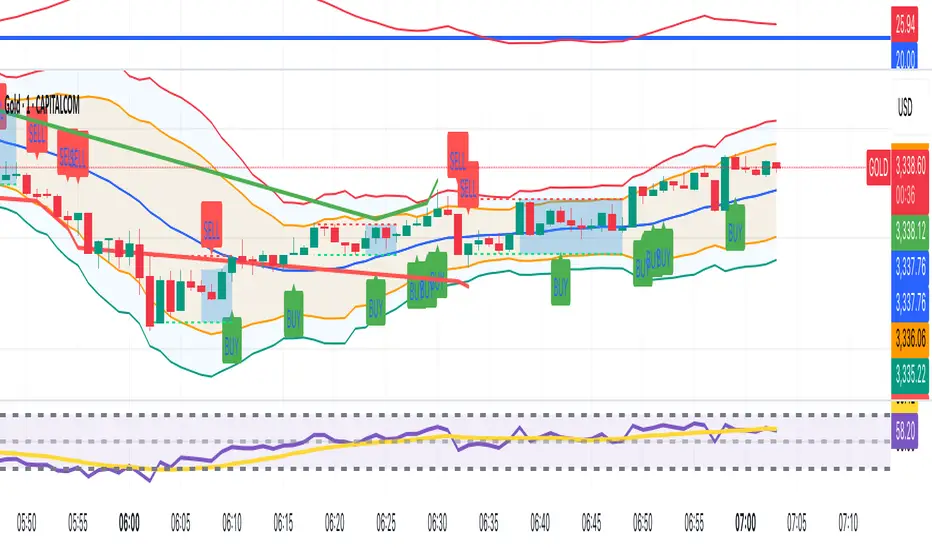
Bollinger Bands: Calculated using a simple moving average (basis) and standard deviation (dev).
EMAs: Two exponential moving averages (EMA 5 and EMA 20) are plotted to identify short-term and long-term trends.
Price Action Patterns: The script detects higher highs and higher lows for bullish conditions, and lower highs and lower lows for bearish conditions.
Trend Strength: An exponential moving average of the price change is used to gauge the strength of the trend.
Trade Signals: Buy and sell signals are plotted on the chart when specific conditions are met, combining price action patterns, trend strength, Bollinger Bands, and EMA crossovers.
Take-Profit Levels: Dynamic take-profit levels are calculated based on recent swing highs and lows, adjusted by a user-defined multiplier. These levels are displayed on the chart using plot to draw horizontal lines.
Open-source script
In true TradingView spirit, the creator of this script has made it open-source, so that traders can review and verify its functionality. Kudos to the author! While you can use it for free, remember that republishing the code is subject to our House Rules.
Disclaimer
The information and publications are not meant to be, and do not constitute, financial, investment, trading, or other types of advice or recommendations supplied or endorsed by TradingView. Read more in the Terms of Use.