OPEN-SOURCE SCRIPT
HSI - Halving Seasonality Index for Bitcoin (BTC) [Logue]
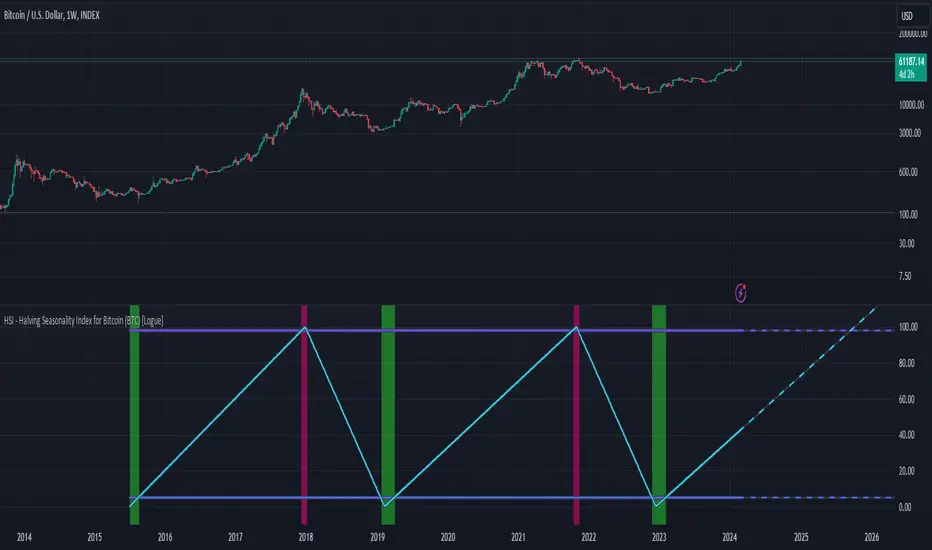
Halving Seasonality Index (HSI) for Bitcoin (BTC) - The HSI takes advantage of the consistency of BTC cycles. Past cycles have formed macro tops around 538 days after each halving. Past cycles have formed macro bottoms every 948 days after each halving. Therefore, a linear "risk" curve can be created between the bottom and top dates to measure how close BTC might be to a bottom or a top. The default triggers are set at 98% risk for tops and 5% risk for bottoms. Extensions are also added as defaults to allow easy identification of the dates of the next top or bottom according to the HSI.
Open-source script
In true TradingView spirit, the creator of this script has made it open-source, so that traders can review and verify its functionality. Kudos to the author! While you can use it for free, remember that republishing the code is subject to our House Rules.
Disclaimer
The information and publications are not meant to be, and do not constitute, financial, investment, trading, or other types of advice or recommendations supplied or endorsed by TradingView. Read more in the Terms of Use.