OPEN-SOURCE SCRIPT
Updated EPS Dashboard
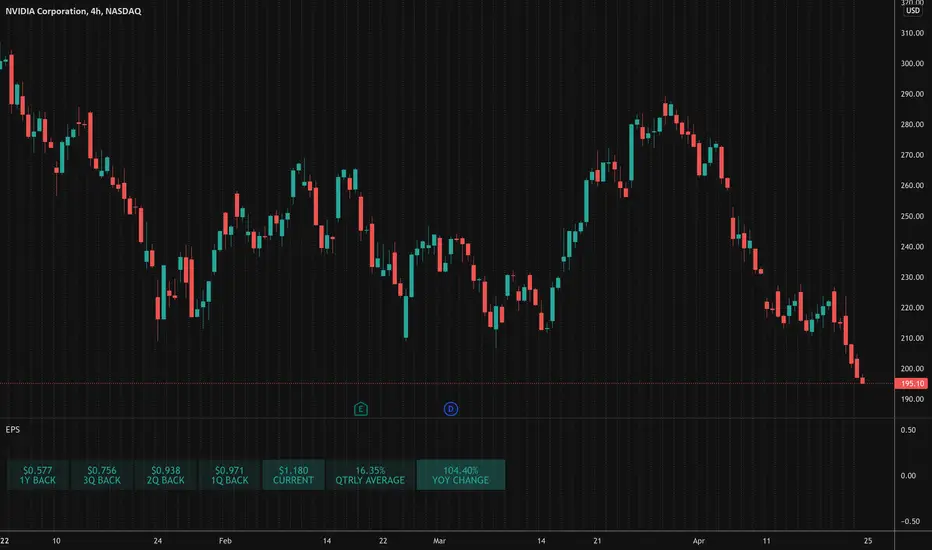
This script creates a little table in an indicator below your chart that allows you to view the earnings per share over the last year as well as calculates the year over year earnings per share growth. According to IBD, strong EPS growth is a great indicator of a potential super-performer stock so hopefully this will make it easier to keep an eye on this metric. Note it does not work on things without financial data like crypto, indexes, and ETFs.
Release Notes
Added a table cell that looks at the average quarterly EPS growth over the last three quarters so you can see a smoother view of how the company's earnings have grown more recently on average vs. just looking at the single YOY comparison.Open-source script
In true TradingView spirit, the creator of this script has made it open-source, so that traders can review and verify its functionality. Kudos to the author! While you can use it for free, remember that republishing the code is subject to our House Rules.
Disclaimer
The information and publications are not meant to be, and do not constitute, financial, investment, trading, or other types of advice or recommendations supplied or endorsed by TradingView. Read more in the Terms of Use.
Open-source script
In true TradingView spirit, the creator of this script has made it open-source, so that traders can review and verify its functionality. Kudos to the author! While you can use it for free, remember that republishing the code is subject to our House Rules.
Disclaimer
The information and publications are not meant to be, and do not constitute, financial, investment, trading, or other types of advice or recommendations supplied or endorsed by TradingView. Read more in the Terms of Use.