OPEN-SOURCE SCRIPT
Updated swami_rsi
Description:
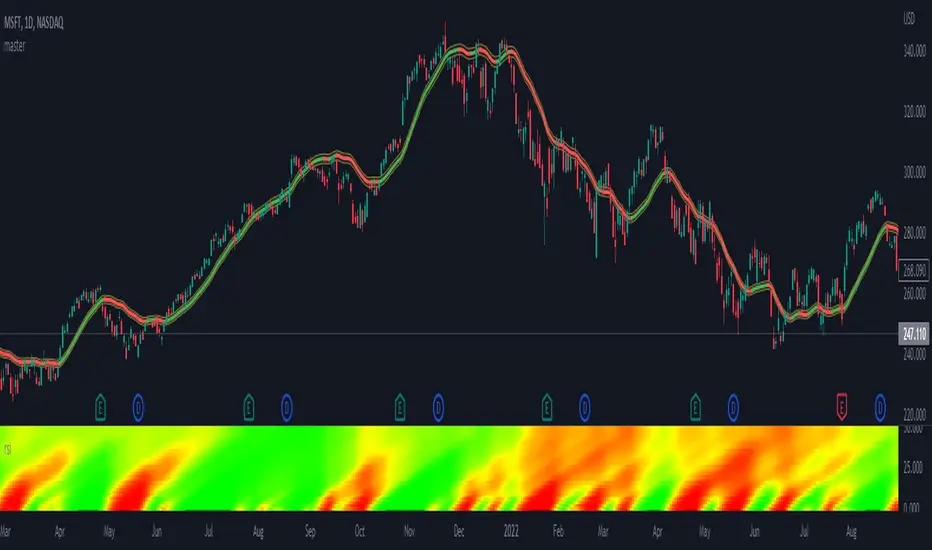
As in the practices, most traders find it hard to set the proper lookback period of the indicator to be used. SwamiCharts offers a comprehensive way to visualize the indicator used over a range of lookback periods. The SwamiCharts of Relative Strength Index (RSI), was developed by Ehlers - see Cycle Analytics for Traders, chapter 16. The indicator was computed over multiple times of the range of lookback period for the Relative Strength Index (RSI), from the deficient period to the relatively high lookback period i.e. 1 to 48, then plotted as one heatmap.
Features:
- In this indicator, the improvement is to utilize the color(dot)rgb() function, which finds to giving a relatively lower time to compute, and follows the original color scheme.
- The confirmation level, which assumed of 25
Release Notes
adding high-pass filter optionswith high-pass filter example:
https://tradingview.sweetlogin.com/x/MSqgLRLK/
Open-source script
In true TradingView spirit, the creator of this script has made it open-source, so that traders can review and verify its functionality. Kudos to the author! While you can use it for free, remember that republishing the code is subject to our House Rules.
Disclaimer
The information and publications are not meant to be, and do not constitute, financial, investment, trading, or other types of advice or recommendations supplied or endorsed by TradingView. Read more in the Terms of Use.