OPEN-SOURCE SCRIPT
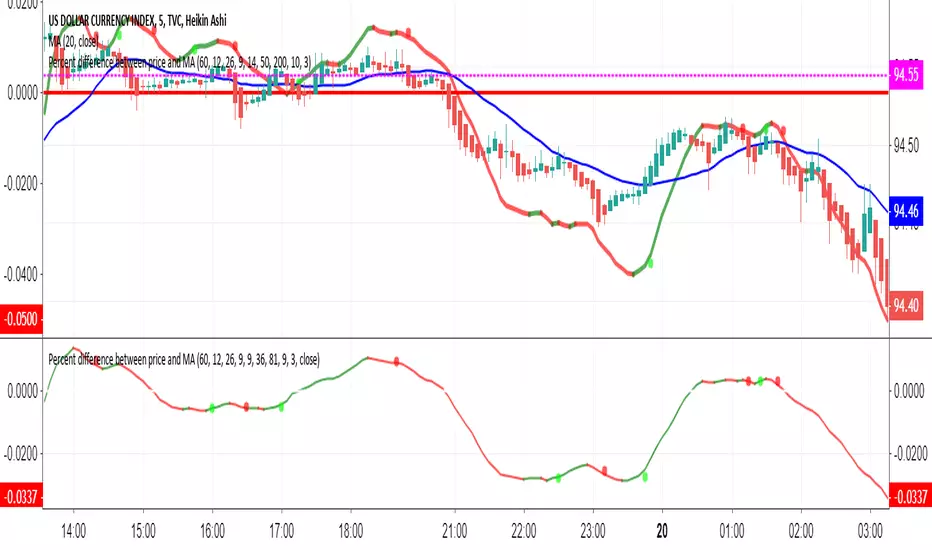
ec tEST cODE FOR pERCENT DIFERENCE
////////////////////////////////////////////////////////////
// Copyright by HPotter v1.0 04/04/2015
// Percent difference between price and MA
////////////////////////////////////////////////////////////
study(title="Percent difference between price and MA")
source = close
useCurrentRes = input(true, title="Use Current Chart Resolution?")
resCustom = input(title="Use Different Timeframe? Uncheck Box Above", type=resolution, defval="60")
smd = input(true, title="Show MacD & Signal Line? Also Turn Off Dots Below")
sd = input(true, title="Show Dots When MacD Crosses Signal Line?")
sh = input(true, title="Show Histogram?")
macd_colorChange = input(true,title="Change MacD Line Color-Signal Line Cross?")
hist_colorChange = input(true,title="MacD Histogram 4 Colors?")
res = useCurrentRes ? period : resCustom
fastLength = input(12, minval=1), slowLength=input(26,minval=1)
signalLength=input(9,minval=1)
fastMA = ema(source, fastLength)
slowMA = ema(source, slowLength)
Length = input(9, minval=1)
Length2= input(36,minval=1)
Length3= input(81,minval=1)
AveragePrice= input(9,minval=1)
Length5= input(3,minval=1)
xSMA = (sma(close, Length)+sma(close, Length2)+sma(close, Length3))/3
pSAM=sma(close, AveragePrice)
nRes = (pSAM - xSMA) * 100 / close
signalnRes = sma(nRes, signalLength)
macd = nRes
signal = sma(macd, signalLength)
hist = macd - signal
outMacD = security(tickerid, res, macd)
outSignal = security(tickerid, res, signal)
outHist = security(tickerid, res, hist)
histA_IsUp = outHist > outHist[1] and outHist > 0
histA_IsDown = outHist < outHist[1] and outHist > 0
histB_IsDown = outHist < outHist[1] and outHist <= 0
histB_IsUp = outHist > outHist[1] and outHist <= 0
//MacD Color Definitions
macd_IsAbove = outMacD >= outSignal
macd_IsBelow = outMacD < outSignal
plot_color = hist_colorChange ? histA_IsUp ? aqua : histA_IsDown ? blue : histB_IsDown ? red : histB_IsUp ? maroon :yellow :gray
macd_color = macd_colorChange ? macd_IsAbove ? lime : red : red
signal_color = macd_colorChange ? macd_IsAbove ? yellow : yellow : lime
circleYPosition = outSignal
// MA COLOR DEFINITION
maColor = change(nRes)>0 ? green : change(nRes)<0 ? red : na
mA_IsAbove = nRes> 0
mA_IsBelow = nRes< 0
plot( nRes, color=maColor, style=line, title="MMA", linewidth=2)
//plot(smd and signalnRes ? signalnRes : na, title="Signal Line", color=signal_color, style=line ,linewidth=2)
//plot(smd and outMacD ? outMacD : na, title="MACD", color=macd_color, linewidth=4)
//plot(smd and outSignal ? outSignal : na, title="Signal Line", color=signal_color, style=line ,linewidth=2)
//plot(sh and outHist ? outHist : na, title="Histogram", color=plot_color, style=histogram, linewidth=4)
plot(sd and cross(outMacD, outSignal) ? circleYPosition : na, title="Cross", style=circles, linewidth=4, color=macd_color)
hline(0, '0 Line', linestyle=solid, linewidth=2, color=white)
//////ALERT cONDITION////
src = input(close)
ma_1 = sma(src, 20)
ma_2 = sma(src, 10)
c = cross(ma_1, ma_2)
alertcondition(c, title='Red crosses blue', message='Red and blue have crossed!')
d = cross(outMacD, outSignal)
alertcondition(d, title='GOING DOWN', message='SELL!')
//
//e = cross(outSignal, outMacD)
//alertcondition(E, title='GOING UP', message='BUY!')
Open-source script
In true TradingView spirit, the creator of this script has made it open-source, so that traders can review and verify its functionality. Kudos to the author! While you can use it for free, remember that republishing the code is subject to our House Rules.
Disclaimer
The information and publications are not meant to be, and do not constitute, financial, investment, trading, or other types of advice or recommendations supplied or endorsed by TradingView. Read more in the Terms of Use.