OPEN-SOURCE SCRIPT
Mora's Compression Indicator
Introducing Mora's Price Compression indicator.
One of the biggest challenges in trading strategies is to differentiate between zones in which price is consolidated (so called squeezed) and zones of price expansion. Zones of consolidation can indicate traders' indecision or the creation of order blocks, but regardless of their mechanism, most indicators behave differently in those areas as oppose to times when price is trending.
A traditional indicator of consolidation zones is the so call Squeeze, which combines Bollinger Bands and Keltner’s Channels.. although broadly used, its interpretation is not quite straightforward.
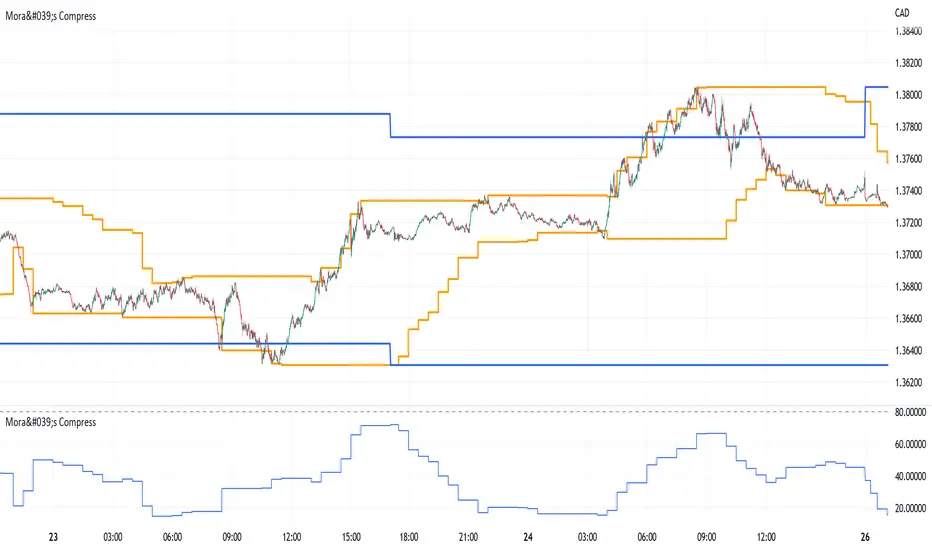
Here a new indicator is introduced to identify areas of consolidation or expansion based on current and historical volatility.
Ultimately we know the price is consolidated (current volatility) when it starts raging within a narrower band that we are use to see (Historical volatility), so the ratio of the current to historical volatility becomes a straightforward identification of consolidation zones and that is what this indicator provides.
The indicator is scaled such that values near zero mean price is compressed and values near 100 price is over-extended. The indicators is designed to allow different time-frames, while avoiding repainting.
One of the biggest challenges in trading strategies is to differentiate between zones in which price is consolidated (so called squeezed) and zones of price expansion. Zones of consolidation can indicate traders' indecision or the creation of order blocks, but regardless of their mechanism, most indicators behave differently in those areas as oppose to times when price is trending.
A traditional indicator of consolidation zones is the so call Squeeze, which combines Bollinger Bands and Keltner’s Channels.. although broadly used, its interpretation is not quite straightforward.
Here a new indicator is introduced to identify areas of consolidation or expansion based on current and historical volatility.
Ultimately we know the price is consolidated (current volatility) when it starts raging within a narrower band that we are use to see (Historical volatility), so the ratio of the current to historical volatility becomes a straightforward identification of consolidation zones and that is what this indicator provides.
The indicator is scaled such that values near zero mean price is compressed and values near 100 price is over-extended. The indicators is designed to allow different time-frames, while avoiding repainting.
Open-source script
In true TradingView spirit, the creator of this script has made it open-source, so that traders can review and verify its functionality. Kudos to the author! While you can use it for free, remember that republishing the code is subject to our House Rules.
Disclaimer
The information and publications are not meant to be, and do not constitute, financial, investment, trading, or other types of advice or recommendations supplied or endorsed by TradingView. Read more in the Terms of Use.