OPEN-SOURCE SCRIPT
Updated Floating RSI Indicator
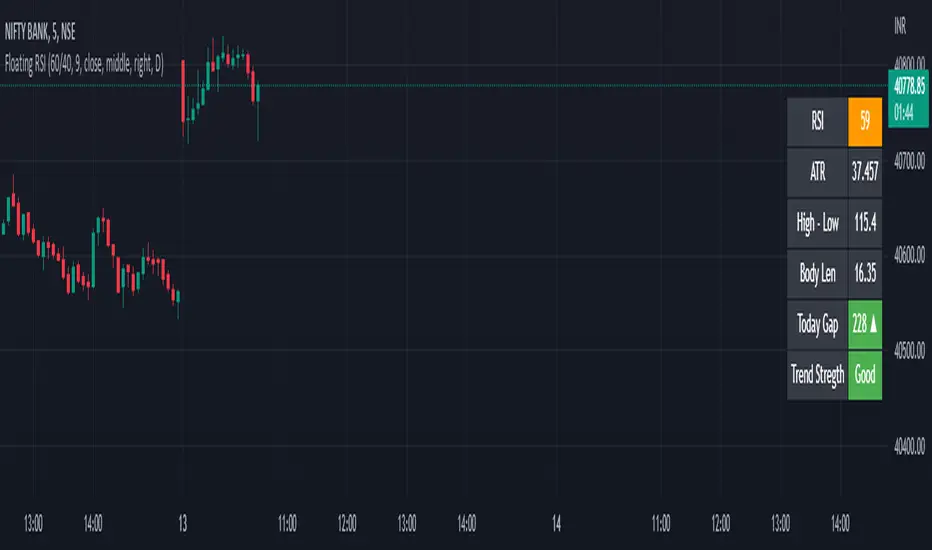
The Simple Floating Relative Index Strength Indicator to analysis the real time value of RSI along with High Minus Low of Day , Week and Monthly candle value and Real time Candle Body size. Simple indications of colors i.e. green indicates bullish and red indicates Bearish
Release Notes
- Gaps / Gap Down Value
Release Notes
- Minor Modification in gap up / gap down values
Release Notes
- Minor calculation Fix and Zone color of RSI changed
Release Notes
Atr value and Trend Strength Added for better analysisRelease Notes
The RSI Label added, it will display the current RSI value on the top of the bar. to enable -> go the setting panel -> enable the RSI Label Option.it works in any timeframe.
Open-source script
In true TradingView spirit, the creator of this script has made it open-source, so that traders can review and verify its functionality. Kudos to the author! While you can use it for free, remember that republishing the code is subject to our House Rules.
Disclaimer
The information and publications are not meant to be, and do not constitute, financial, investment, trading, or other types of advice or recommendations supplied or endorsed by TradingView. Read more in the Terms of Use.