OPEN-SOURCE SCRIPT
AI Momentum Cloud v6
📌 AI Momentum Cloud v6 – Strategy Overview & Logic
📊 Overview
The AI Momentum Cloud v6 strategy is a dynamic breakout system designed to identify directional moves when price escapes a volatility-defined “cloud” and is supported by momentum. The model combines a custom implementation of Kaufman's Adaptive Moving Average (KAMA) with MACD histogram momentum filtering and an ATR-based cloud envelope. It aims to detect actionable impulses while minimizing noise in ranging markets.
This strategy is suitable for:
* Intraday timeframes (15m, 1h)
* Stocks and crypto assets with trend potential (e.g., AAPL, TSLA, BTCUSD, SPY)
* Traders who want visual clarity and logic-driven risk
⚙️ Technical Logic
1. Trend Base – KAMA
A manually coded version of Kaufman's Adaptive Moving Average (KAMA) is used to adapt to market conditions. This indicator reacts quickly in trending markets but smooths out sideways chop.
2. Momentum Confirmation – MACD Histogram
Only trades in the direction of positive MACD histogram (for longs) or negative histogram (for shorts) are allowed. This avoids entering into fake breakouts without true momentum.
3. Cloud Envelope – ATR-Based Bands
The strategy draws two dynamic bands around KAMA using the Average True Range (ATR):
* Upper Band = KAMA + (ATR × Multiplier)
* Lower Band = KAMA − (ATR × Multiplier)
Price must break through these bands with momentum to qualify as a valid signal.
📥 Entry Conditions
📈 Long Entry:
* Price crosses above the upper cloud band
* Close is above KAMA
* MACD Histogram is positive
📉 Short Entry:
* Price crosses below the lower cloud band
* Close is below KAMA
* MACD Histogram is negative
These conditions ensure that trades align with both trend and momentum.
📤 Exit Conditions
Each trade is exited based on **adaptive volatility targets:
* Take Profit = Entry Price ± (ATR × TP Multiplier)
* Stop Loss = Entry Price ∓ (ATR × SL Multiplier)
No trailing stops or time exits are used, making this a clean 1-shot trade system per signal.
📐 Risk Management
* Default risk size is set to 1% of equity per trade via `strategy.percent_of_equity`
* Both TP and SL are dynamically adjusted to market volatility using ATR
* This protects against overreacting in low-volatility environments and underreacting in high-volatility zones
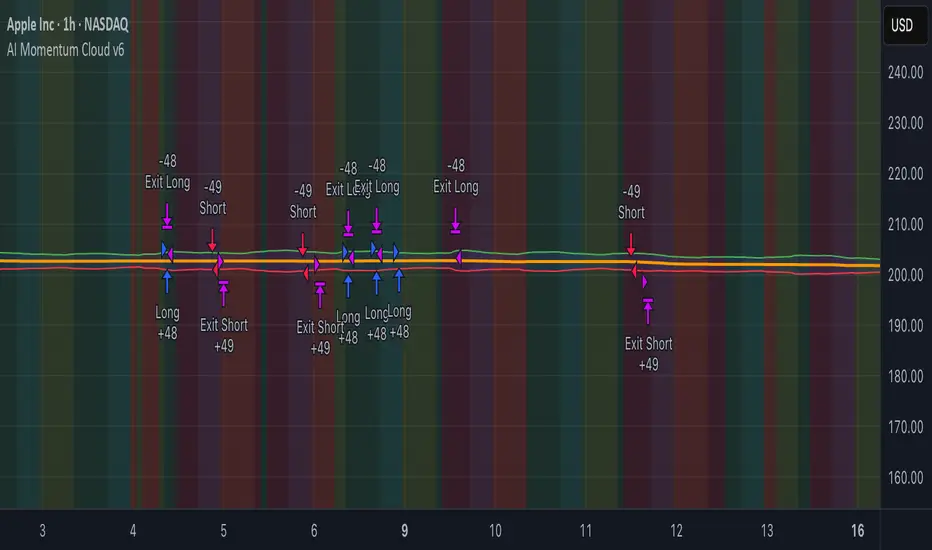
📊 Visual Features
*Orange KAMA line: Shows the adaptive trend center
*Green and Red Bands: Represent breakout thresholds
*Blue Cloud Fill: Visualizes volatility envelope
*Background Color: Green/red tint for momentum condition (MACD histogram > 0 or < 0)
These cues help manual traders validate live signals alongside the automated entries/exits.
⚠️ Disclaimer
> This strategy is intended for educational and research purposes only. It does not constitute financial advice, a recommendation to buy/sell any asset, or a guarantee of performance. Always backtest and forward-test strategies in a simulated environment before considering live use.
> The logic and risk settings should be tailored to the user’s own risk tolerance and market.
📊 Overview
The AI Momentum Cloud v6 strategy is a dynamic breakout system designed to identify directional moves when price escapes a volatility-defined “cloud” and is supported by momentum. The model combines a custom implementation of Kaufman's Adaptive Moving Average (KAMA) with MACD histogram momentum filtering and an ATR-based cloud envelope. It aims to detect actionable impulses while minimizing noise in ranging markets.
This strategy is suitable for:
* Intraday timeframes (15m, 1h)
* Stocks and crypto assets with trend potential (e.g., AAPL, TSLA, BTCUSD, SPY)
* Traders who want visual clarity and logic-driven risk
⚙️ Technical Logic
1. Trend Base – KAMA
A manually coded version of Kaufman's Adaptive Moving Average (KAMA) is used to adapt to market conditions. This indicator reacts quickly in trending markets but smooths out sideways chop.
2. Momentum Confirmation – MACD Histogram
Only trades in the direction of positive MACD histogram (for longs) or negative histogram (for shorts) are allowed. This avoids entering into fake breakouts without true momentum.
3. Cloud Envelope – ATR-Based Bands
The strategy draws two dynamic bands around KAMA using the Average True Range (ATR):
* Upper Band = KAMA + (ATR × Multiplier)
* Lower Band = KAMA − (ATR × Multiplier)
Price must break through these bands with momentum to qualify as a valid signal.
📥 Entry Conditions
📈 Long Entry:
* Price crosses above the upper cloud band
* Close is above KAMA
* MACD Histogram is positive
📉 Short Entry:
* Price crosses below the lower cloud band
* Close is below KAMA
* MACD Histogram is negative
These conditions ensure that trades align with both trend and momentum.
📤 Exit Conditions
Each trade is exited based on **adaptive volatility targets:
* Take Profit = Entry Price ± (ATR × TP Multiplier)
* Stop Loss = Entry Price ∓ (ATR × SL Multiplier)
No trailing stops or time exits are used, making this a clean 1-shot trade system per signal.
📐 Risk Management
* Default risk size is set to 1% of equity per trade via `strategy.percent_of_equity`
* Both TP and SL are dynamically adjusted to market volatility using ATR
* This protects against overreacting in low-volatility environments and underreacting in high-volatility zones
📊 Visual Features
*Orange KAMA line: Shows the adaptive trend center
*Green and Red Bands: Represent breakout thresholds
*Blue Cloud Fill: Visualizes volatility envelope
*Background Color: Green/red tint for momentum condition (MACD histogram > 0 or < 0)
These cues help manual traders validate live signals alongside the automated entries/exits.
⚠️ Disclaimer
> This strategy is intended for educational and research purposes only. It does not constitute financial advice, a recommendation to buy/sell any asset, or a guarantee of performance. Always backtest and forward-test strategies in a simulated environment before considering live use.
> The logic and risk settings should be tailored to the user’s own risk tolerance and market.
Open-source script
In true TradingView spirit, the creator of this script has made it open-source, so that traders can review and verify its functionality. Kudos to the author! While you can use it for free, remember that republishing the code is subject to our House Rules.
Disclaimer
The information and publications are not meant to be, and do not constitute, financial, investment, trading, or other types of advice or recommendations supplied or endorsed by TradingView. Read more in the Terms of Use.