OPEN-SOURCE SCRIPT
Previous Two Days HL + Asia H/L + 4H Vertical Lines
📊 Indicator Overview
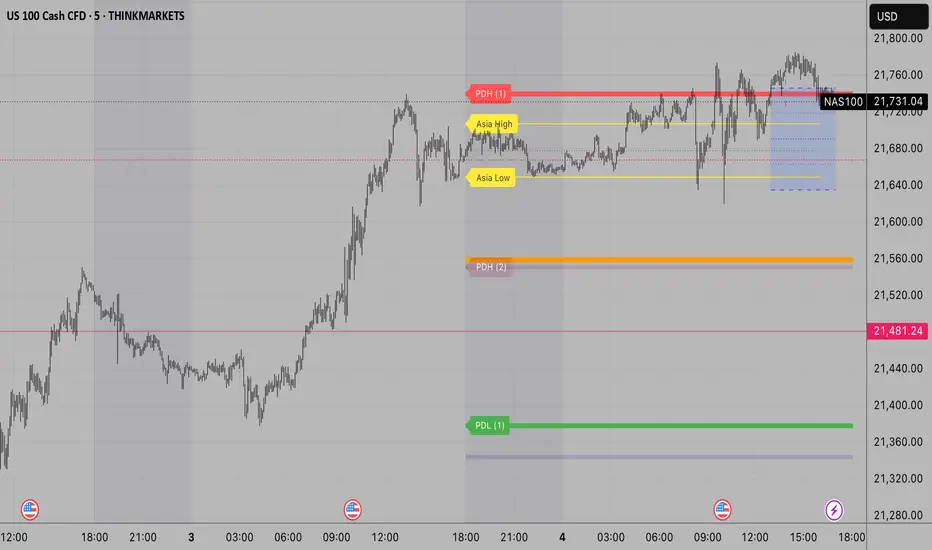
This custom TradingView indicator visually marks key market structure levels and session data on your chart using lines, labels, boxes, and vertical guides. It is designed for traders who analyze intraday and multi-session behavior — especially around the New York and Asia sessions — with a focus on 4-hour price ranges.
🔍 What the Indicator Tracks
1. Previous Two Days' Ranges (6PM–5PM NY Time)
PDH/PDL (Day 1 & Day 2): Draws horizontal lines marking the previous two trading days’ highs and lows.
Midlines: Calculates and displays the midpoint between each day’s high and low.
Color-Coded: Uses strong colors for Day 1 and more transparent versions for Day 2, to help differentiate them.
2. Asia Session High/Low (6 PM – 2 AM NY Time)
Automatically tracks the high and low during the Asia session.
Extends these levels until the following day’s NY close (4 PM).
Shows a midline of the Asia session (optional dotted line).
Highlights the Asia session background in gray.
Labels Asia High and Low on the chart for easy reference.
3. Last Closed 4-Hour Candle Range
At the start of every new 4H candle, it:
Draws a box from the last closed 4H candle.
Box spans horizontally across a set number of bars (adjustable).
Top and bottom lines indicate the high and low of that 4H candle.
Midline, 25% (Q1) and 75% (Q3) levels are also drawn inside the box using dotted lines.
Helps traders identify premium/discount zones within the previous 4H range.
4. Vertical 4H Time Markers
Draws vertical dashed lines to mark the start and end of the last 4H candle range.
Based on the standard 4H bar timing in NY (e.g. 5:00, 9:00, 13:00, 17:00).
⚙️ Inputs & Options
Line thickness, color customization for all levels.
Option to place labels on the right or left side of the chart.
Toggle for enabling/disabling the 4H box.
Adjustable box extension length (how far to extend the range visually).
✅ Ideal Use Cases
Identifying reaction zones from prior highs/lows.
Spotting reversals during Asia or NY session opens.
Trading intraday setups based on 4H structure.
Anchoring scalping or swing entries off major session levels.
Open-source script
In true TradingView spirit, the creator of this script has made it open-source, so that traders can review and verify its functionality. Kudos to the author! While you can use it for free, remember that republishing the code is subject to our House Rules.
Disclaimer
The information and publications are not meant to be, and do not constitute, financial, investment, trading, or other types of advice or recommendations supplied or endorsed by TradingView. Read more in the Terms of Use.