OPEN-SOURCE SCRIPT
Updated Momentum 2.0 [AstrideUnicorn]
Momentum 2.0 is a normalized Momentum oscillator with a moving base-level. The oscillator value is normalized by its standard deviation, similar to the z-score technique. Instead of the zero level, the indicator uses the base-level calculated as the inverted long-term average value of the oscillator. Similar to the zero-level crossing signal used for the Momentum oscillator, our oscillator calculates the base level crossing signal.
The moving base-level helps to reduce the number of false signals. In an uptrend the base-level is below zero, in a downtrend it is above it. This allows us to take into account the trend stability effect. In this case, to form a reversal signal, the oscillator must cross a lower value in an uptrend and a higher value in a downtrend.
HOW TO USE
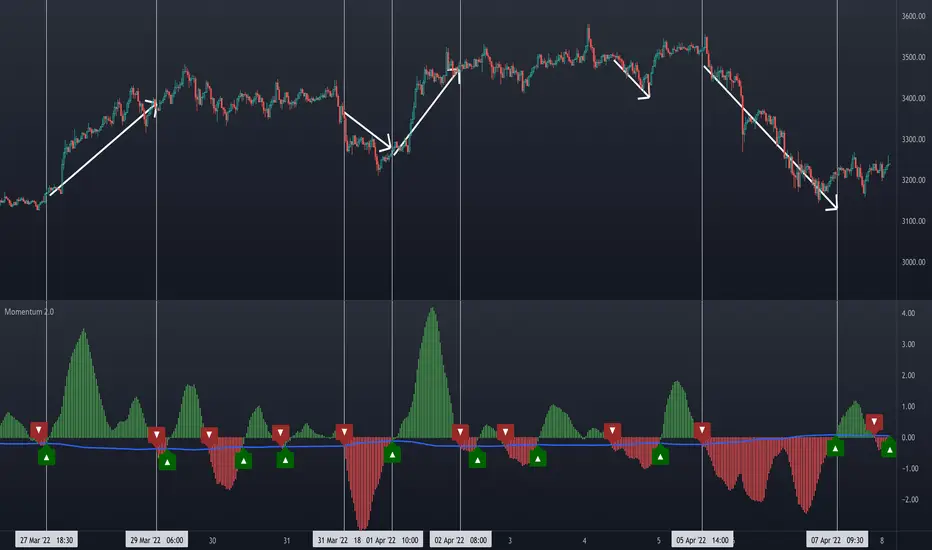
When the oscillator crosses above the base-level, it gives a bullish signal, when below it gives a bearish signal. The signals are displayed as green and red labels, respectively.
The color of the histogram shows the current direction of the price momentum. Green indicates an upward move and red indicates a downward move. The blue line represents the base-level.
SETTINGS
Oscillator Period - determines the period of the Momentum oscillator
Base Level Period - determines the period used for long-term averaging when calculating the base-level and normalizing the oscillator
The moving base-level helps to reduce the number of false signals. In an uptrend the base-level is below zero, in a downtrend it is above it. This allows us to take into account the trend stability effect. In this case, to form a reversal signal, the oscillator must cross a lower value in an uptrend and a higher value in a downtrend.
HOW TO USE
When the oscillator crosses above the base-level, it gives a bullish signal, when below it gives a bearish signal. The signals are displayed as green and red labels, respectively.
The color of the histogram shows the current direction of the price momentum. Green indicates an upward move and red indicates a downward move. The blue line represents the base-level.
SETTINGS
Oscillator Period - determines the period of the Momentum oscillator
Base Level Period - determines the period used for long-term averaging when calculating the base-level and normalizing the oscillator
Release Notes
Updated the BUY and SELL signals. Now they show only on the close of bars when they are confirmed. Added alerts for BUY and SELL signals.Open-source script
In true TradingView spirit, the creator of this script has made it open-source, so that traders can review and verify its functionality. Kudos to the author! While you can use it for free, remember that republishing the code is subject to our House Rules.
Our premium trading indicators: unicorn.trading
Join our Discord community: dsc.gg/unicom
Join our Discord community: dsc.gg/unicom
Disclaimer
The information and publications are not meant to be, and do not constitute, financial, investment, trading, or other types of advice or recommendations supplied or endorsed by TradingView. Read more in the Terms of Use.
Open-source script
In true TradingView spirit, the creator of this script has made it open-source, so that traders can review and verify its functionality. Kudos to the author! While you can use it for free, remember that republishing the code is subject to our House Rules.
Our premium trading indicators: unicorn.trading
Join our Discord community: dsc.gg/unicom
Join our Discord community: dsc.gg/unicom
Disclaimer
The information and publications are not meant to be, and do not constitute, financial, investment, trading, or other types of advice or recommendations supplied or endorsed by TradingView. Read more in the Terms of Use.