OPEN-SOURCE SCRIPT
Stochastic RSI with Crossover Arrows
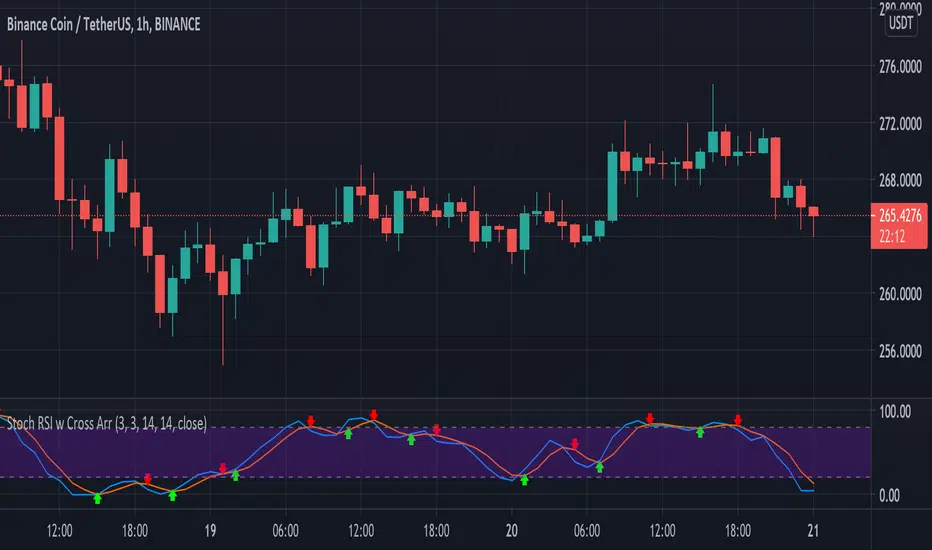
The Stochastic RSI indicator (Stoch RSI) is essentially an indicator of an indicator. It is used in technical analysis to provide a stochastic calculation to the RSI indicator. This means that it is a measure of RSI relative to its own high/low range over a user defined period of time. The Stochastic RSI is an oscillator that calculates a value between 0 and 1 which is then plotted as a line. This indicator is primarily used for identifying overbought and oversold conditions.
In this update, crossover arrows helps your trade.
In this update, crossover arrows helps your trade.
Open-source script
In true TradingView spirit, the creator of this script has made it open-source, so that traders can review and verify its functionality. Kudos to the author! While you can use it for free, remember that republishing the code is subject to our House Rules.
Disclaimer
The information and publications are not meant to be, and do not constitute, financial, investment, trading, or other types of advice or recommendations supplied or endorsed by TradingView. Read more in the Terms of Use.