OPEN-SOURCE SCRIPT
MTI Stochastic RSI with Color Bars and Zones
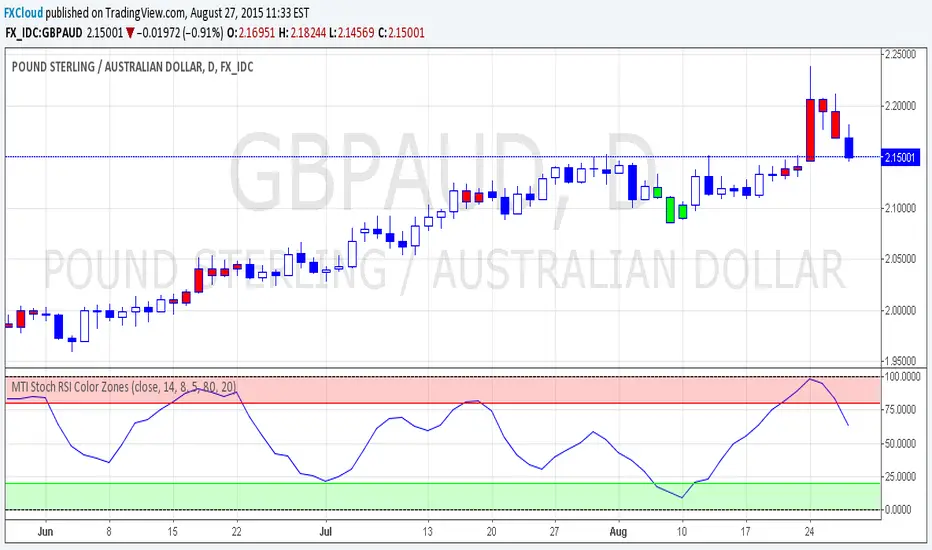
Plots the %D line of a Stochastic Oscillator calculated from the RSI of close of length 14.
Red Sell Zone above 80, candles paint red
Green Buy Zone below 20, candles paint green
Red Sell Zone above 80, candles paint red
Green Buy Zone below 20, candles paint green
Open-source script
In true TradingView spirit, the creator of this script has made it open-source, so that traders can review and verify its functionality. Kudos to the author! While you can use it for free, remember that republishing the code is subject to our House Rules.
Disclaimer
The information and publications are not meant to be, and do not constitute, financial, investment, trading, or other types of advice or recommendations supplied or endorsed by TradingView. Read more in the Terms of Use.