OPEN-SOURCE SCRIPT
Updated RSI Bands + Levels (Miu)
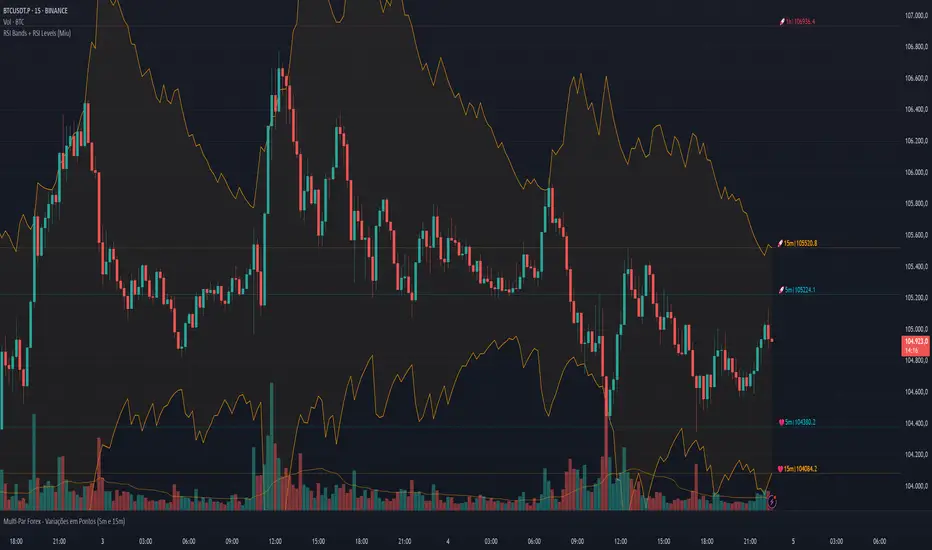
This indicator was designed to plot lines from prices of overbought (OB) and oversold (OS) RSI levels in chart. It will also create a visible band between these levels.
It's main utility is to show in chart current and past prices for OB/OS RSI levels. Traditionally the RSI is considered overbought when above 70 and oversold when below 30 but you can customize these values in settings. The RSI oscillates between zero and 100.
Users can easily identify overbought and oversold prices using this indicator and then it is expected to help users to make better strategic decisions with their trades.
There are some extra options available in settings:
- Customizable RSI levels
- Customizable RSI length
- RSI Levels: if activated, it will draw lines above OB line and below OS line according to the multiplier, so it will plot sequential lines that goes in different RSI levels (e.g: RSI 72, 74, 76, 78 and 80).
- Backgroud only: it will remove these lines and keep only a backgroung color instead
- RSI 50: it will draw a line as RSI 50
- Customizable multiplier
Enjoy!
Release Notes
Bug fixes:1) Fixed some bugs on some line plots which stopped to work properly after some update in tradingview
2) Fixed an error on code that was not showing the last line when RSI Levels was active
Release Notes
Update:- Added label offset settings
Release Notes
Updates:1) Updated to Pine Script v6.
2) Multiple visual improvements, including color schemes tailored to specific timeframes (backgrounds and lines).
3) Addition of multi-timeframe (MTF) lines/levels, shown by default. Note: You can remove these lines.
4) Labels are now always visible and use dotted lines (trackprice).
5) Added icons to overbought and oversold levels, which can be customized or removed.
6) Added option to set line width.
Feel free to report any issues or suggest improvements. Your feedback is always welcome!
Release Notes
Update:1) Minor fix.
Open-source script
In true TradingView spirit, the creator of this script has made it open-source, so that traders can review and verify its functionality. Kudos to the author! While you can use it for free, remember that republishing the code is subject to our House Rules.
Disclaimer
The information and publications are not meant to be, and do not constitute, financial, investment, trading, or other types of advice or recommendations supplied or endorsed by TradingView. Read more in the Terms of Use.