OPEN-SOURCE SCRIPT
Updated ADX+ Oscillator
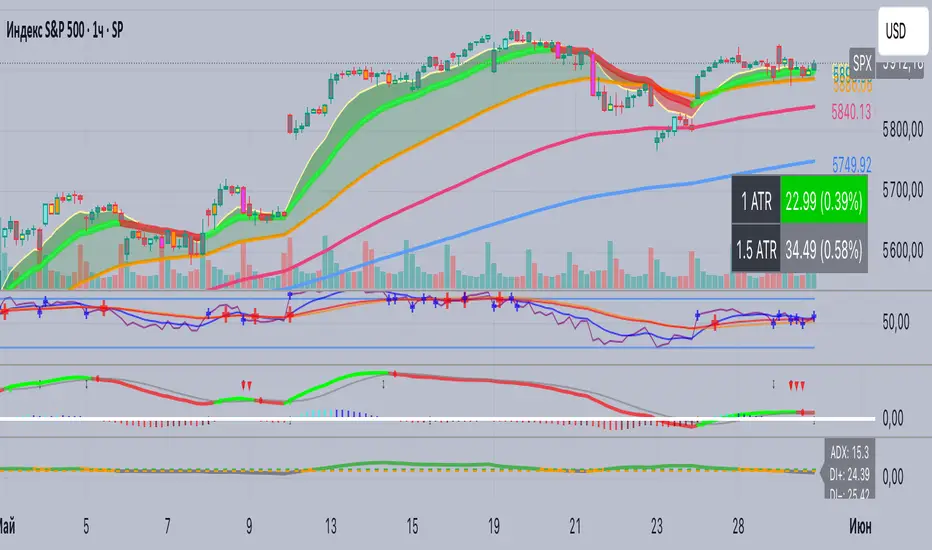
📈 ADX+ Oscillator — Enhanced Trend Strength Indicator
🔹 Description:
A modified oscillator based on the ADX (Average Directional Index), providing both visual and digital interpretation of trend strength and direction. A powerful tool for filtering sideways markets and identifying strong impulses across any timeframe.
🔹 Features:
• ADX line to assess trend strength
• DI+ and DI− lines to determine trend direction
• Colored background zones:
• Gray: ranging market (ADX < 20)
• Orange: transition zone (20 ≤ ADX < 25)
• Green: strong trend (ADX ≥ 25)
• Digital value labels for ADX / DI+ / DI− on the latest candle
• Signal arrows when DI+ crosses DI− and vice versa
🔹 Why use it:
• Signal filtering: avoid trades in flat markets (ADX < 20)
• Trend confirmation: enter only when ADX is rising above 25
• Directional guidance via DI+ and DI− behavior
🔹 Best for:
• Scalping (1m, 5m)
• Intraday trading (15m, 1h)
• Swing trading (4h and above)
• Breakout and pullback strategies
Release Notes
📈 ADX+ Oscillator — Enhanced Trend Strength Indicator🔹 Description:
A modified oscillator based on the ADX (Average Directional Index), providing both visual and digital interpretation of trend strength and direction. A powerful tool for filtering sideways markets and identifying strong impulses across any timeframe.
🔹 Features:
• ADX line to assess trend strength
• DI+ and DI− lines to determine trend direction
• Colored background zones:
• Gray: ranging market (ADX < 20)
• Orange: transition zone (20 ≤ ADX < 25)
• Green: strong trend (ADX ≥ 25)
• Digital value labels for ADX / DI+ / DI− on the latest candle
• Signal arrows when DI+ crosses DI− and vice versa
🔹 Why use it:
• Signal filtering: avoid trades in flat markets (ADX < 20)
• Trend confirmation: enter only when ADX is rising above 25
• Directional guidance via DI+ and DI− behavior
🔹 Best for:
• Scalping (1m, 5m)
• Intraday trading (15m, 1h)
• Swing trading (4h and above)
• Breakout and pullback strategies
Open-source script
In true TradingView spirit, the creator of this script has made it open-source, so that traders can review and verify its functionality. Kudos to the author! While you can use it for free, remember that republishing the code is subject to our House Rules.
Disclaimer
The information and publications are not meant to be, and do not constitute, financial, investment, trading, or other types of advice or recommendations supplied or endorsed by TradingView. Read more in the Terms of Use.