OPEN-SOURCE SCRIPT
Racer Correlation [racer8]
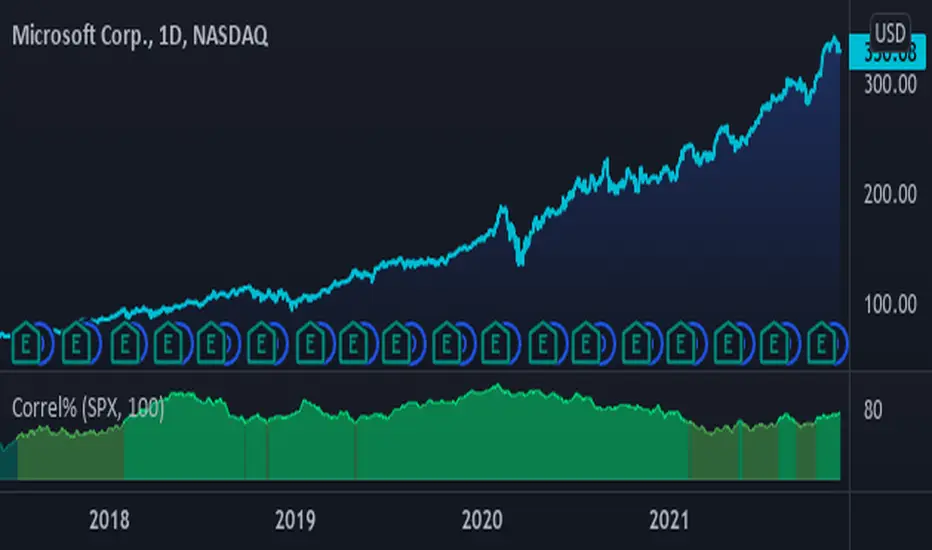
This indicator gauges correlation between 2 markets using my own method I invented. It is far superior to the correlation coefficient in that it maintains steady correlation values, meaning less false signals regarding correlation. Yet, the indicator's calculation is very simple in fact...
It simply calculates the percentage of moves in the same direction as the other market. So if MSFT moved in the same direction as SPX 80% of the time, then the indicator would show you a value of 80. Unlike correlation coefficient, you can calculate exactly how many of MSFT's bars moved in the same direction as SPX's bars. Everytime MSFT moves in the same direction as SPX, it is included in the percentage of positively correlated moves.
Closing prices are used solely in the indicator's calculations. All indicator values represent a percentage. Also, I recommend a length of at least 100 periods.
Values between 0% and 25% indicate strong negative correlation. (bright red)
Values between 25% and 33% indicate moderate negative correlation. (red)
Values between 33% and 50% indicate weak negative correlation. (dark red)
Values between 50% and 67% indicate weak positive correlation. (dark green)
Values between 67% and 75% indicate moderate positive correlation. (green)
Values between 75% and 100% indicate strong positive correlation. (bright green)........Enjoy :)
Open-source script
In true TradingView spirit, the creator of this script has made it open-source, so that traders can review and verify its functionality. Kudos to the author! While you can use it for free, remember that republishing the code is subject to our House Rules.
Disclaimer
The information and publications are not meant to be, and do not constitute, financial, investment, trading, or other types of advice or recommendations supplied or endorsed by TradingView. Read more in the Terms of Use.