OPEN-SOURCE SCRIPT
Updated Moving Average Toolkit
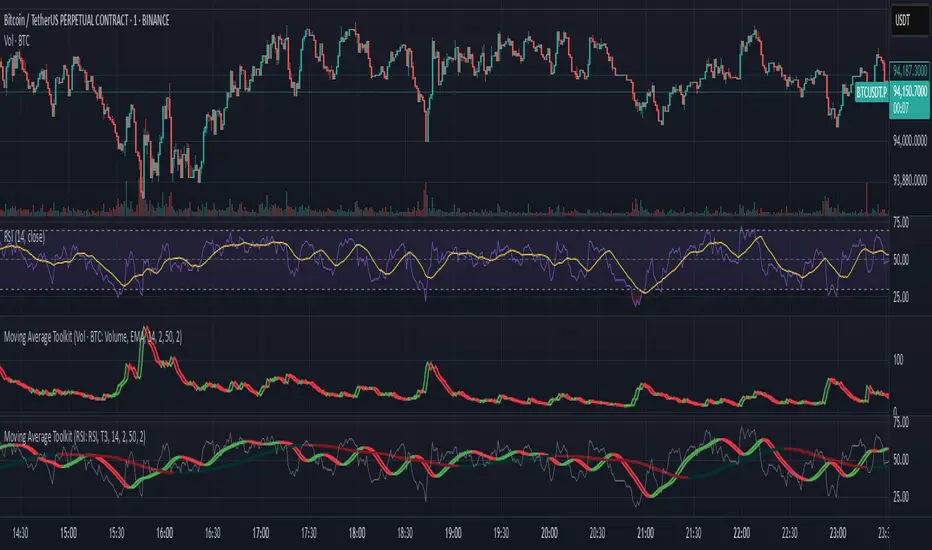
Moving Average Toolkit - Advanced MA Analysis with Flexible Source Input
A powerful and versatile moving average indicator designed for maximum flexibility. Its unique source input feature allows you to analyze moving averages of ANY indicator or price data, making it perfect for creating custom combinations with RSI, Volume, OBV, or any other technical indicator.
Key Features:
• Universal Source Input:
- Analyze moving averages of any data: Price, Volume, RSI, MACD, Custom Indicators
- Perfect for creating advanced technical setups
- Identify trends in any technical data
• 13 Moving Average Types:
- Traditional: SMA, EMA, WMA, RMA, VWMA
- Advanced: HMA, T3, DEMA, TEMA, KAMA, ZLEMA, McGinley, EPMA
• Dual MA System:
- Compare two different moving averages
- Independent settings for each MA
- Perfect for multiple timeframe analysis
• Visual Offset Analysis:
- Dynamic color changes based on momentum
- Fill between current and offset values
- Clear visualization of trend strength
Usage Examples:
• Price Trend: Traditional MA analysis using price data
• Volume Trend: Apply MA to volume for volume trend analysis
• RSI Trend: Smooth RSI movements for clearer signals
• Custom: Apply to any indicator output for unique insights
Settings:
• Fully customizable colors for bull/bear conditions
• Adjustable offset periods
• Independent length settings
• Optional second MA for comparison
Perfect for:
• Advanced technical analysts
• Multi-indicator strategy developers
• Custom indicator creators
• Traders seeking flexible analysis tools
This versatile toolkit goes beyond traditional moving averages by allowing you to apply sophisticated MA analysis to any technical data, creating endless possibilities for custom technical analysis strategies.
Release Notes
Add option to plot source of moving averageRelease Notes
Update chart previewRelease Notes
Update chart privewRelease Notes
These 3 hidden plots have been added to the indicator so you can use them as sources in other indicators:- MA1 Delta: Calculates the difference between MA1 and its offset
- MA2 Delta: Calculates the difference between MA2 and its offset
- MA1 - MA2: Calculates the difference between MA1 and MA2
With this change, you have more flexibility to create complex indicators without coding.
For example, we can recreate the MACD indicator by using this indicator twice.
First indicator:
Source: close
MA Type: EMA
MA1 Length: 12
MA2 Length: 26
Second indicator:
Source: "MATK: MA1 - MA2"
MA Type: EMA
MA1 Length: 9
As you can see, the lines in the second indicator match exactly what we see in a standard MACD indicator.
Open-source script
In true TradingView spirit, the creator of this script has made it open-source, so that traders can review and verify its functionality. Kudos to the author! While you can use it for free, remember that republishing the code is subject to our House Rules.
Disclaimer
The information and publications are not meant to be, and do not constitute, financial, investment, trading, or other types of advice or recommendations supplied or endorsed by TradingView. Read more in the Terms of Use.