OPEN-SOURCE SCRIPT
Updated RSI Support & Resistance by DGT
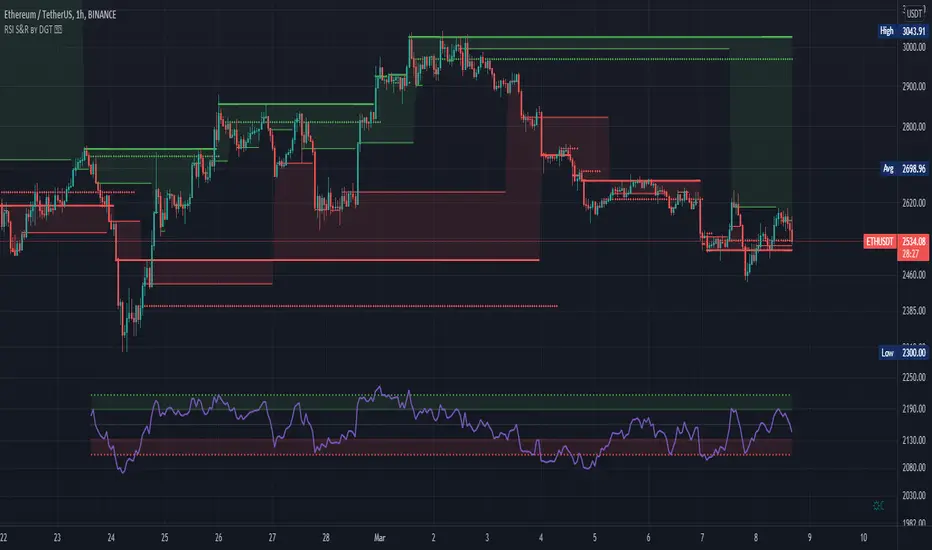
RSI Sᴜᴘᴘᴏʀᴛ & Rᴇꜱɪꜱᴛᴀɴᴄᴇ ʙʏ DGT
This experimental study attempts to translate Relative Strength Index (RSI) threshold levels of oversold/overbought and bull/bear zones as probable Price Support and Resistance levels
█ OPTIONS
Example usage of the study with explanations

█ OTHERS
More regarding Support & Resistance concept (definition, identifying levels, trading S&R, etc) you are kindly invited to check my previous publication
Price Action - Support & Resistance by DGT
More regarding Relative Strength Index (RSI) and Relative Strength of Volume Indicators, please check Relative Strength of Volume Indicators by DGT
Disclaimer:
Trading success is all about following your trading strategy and the indicators should fit within your trading strategy, and not to be traded upon solely
The script is for informational and educational purposes only. Use of the script does not constitute professional and/or financial advice. You alone have the sole responsibility of evaluating the script output and risks associated with the use of the script. In exchange for using the script, you agree not to hold dgtrd TradingView user liable for any possible claim for damages arising from any decision you make based on use of the script
This experimental study attempts to translate Relative Strength Index (RSI) threshold levels of oversold/overbought and bull/bear zones as probable Price Support and Resistance levels
█ OPTIONS
- Support & Resistance Levels, the main aim of the study. Level calculations are based on Relative Strength Index (RSI) threshold levels of oversold/overbought and bull/bear zones, where all threshold values are customizable through the user dialog box. Background of the levels can be colored optionally
- RSI Weighted Colored Bars and/or Mark Overbought/Oversold Bars , [optional] Bar colors can be painted to better emphasis RSI values. Darker colors when the oscillator is in oversold/overbought zones, light colors when oscillator readings are below/above the bull/bear zone respectively, and remain unchanged otherwise. Besides the colors, with “Display RSI Overbought/Oversold Price Bars” option little triangle shapes can be plotted on top or bottom of the bars when RSI is in oversold/overbought zones
Example usage of the study with explanations
█ OTHERS
More regarding Support & Resistance concept (definition, identifying levels, trading S&R, etc) you are kindly invited to check my previous publication
Price Action - Support & Resistance by DGT
More regarding Relative Strength Index (RSI) and Relative Strength of Volume Indicators, please check Relative Strength of Volume Indicators by DGT
Disclaimer:
Trading success is all about following your trading strategy and the indicators should fit within your trading strategy, and not to be traded upon solely
The script is for informational and educational purposes only. Use of the script does not constitute professional and/or financial advice. You alone have the sole responsibility of evaluating the script output and risks associated with the use of the script. In exchange for using the script, you agree not to hold dgtrd TradingView user liable for any possible claim for damages arising from any decision you make based on use of the script
Release Notes
Minor Update* Organized Script Inputs in Sections
* Added Alerts
* Changed study code to look programmatically nicer (no functionality change)
Release Notes
Now available with On Balance Volume (OBV) option as RSI SourceRelease Notes
major update - added ability to display RSI Oscillator on top of price chart (overlay), aplicable for both log and linear scale on all timeframes Open-source script
In true TradingView spirit, the creator of this script has made it open-source, so that traders can review and verify its functionality. Kudos to the author! While you can use it for free, remember that republishing the code is subject to our House Rules.
Our Premium Indicators: sites.google.com/view/solemare-analytics
Disclaimer
The information and publications are not meant to be, and do not constitute, financial, investment, trading, or other types of advice or recommendations supplied or endorsed by TradingView. Read more in the Terms of Use.
Open-source script
In true TradingView spirit, the creator of this script has made it open-source, so that traders can review and verify its functionality. Kudos to the author! While you can use it for free, remember that republishing the code is subject to our House Rules.
Our Premium Indicators: sites.google.com/view/solemare-analytics
Disclaimer
The information and publications are not meant to be, and do not constitute, financial, investment, trading, or other types of advice or recommendations supplied or endorsed by TradingView. Read more in the Terms of Use.