OPEN-SOURCE SCRIPT
Market Breadth Ratios Overlay
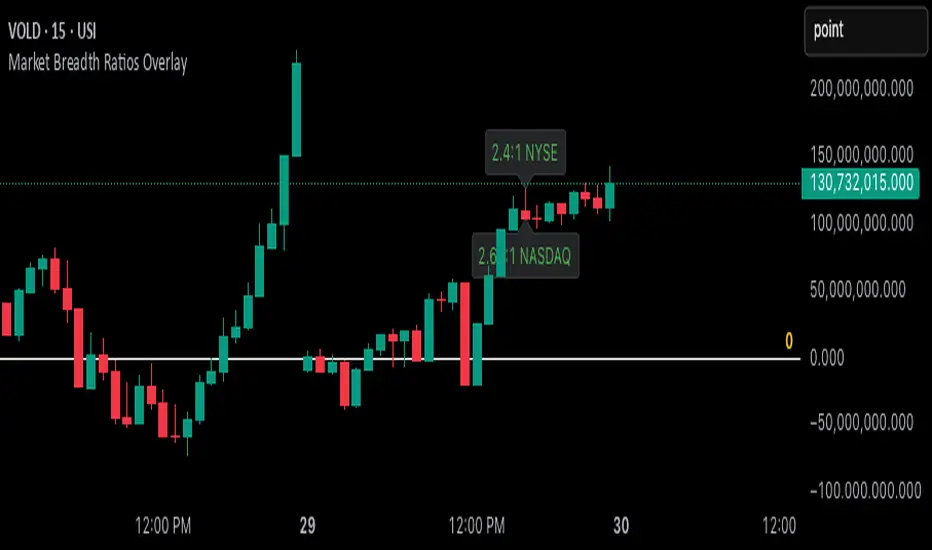
This overlay indicator displays the up/down volume breadth ratio for both the NYSE and NASDAQ directly on your chart.
Ratios are calculated using volume data from:
USI:UVOL, USI:DVOL (NYSE)
USI:UVOLQ, USI:DVOLQ (NASDAQ)
A green label indicates more up volume than down volume (bullish breadth).
A red label indicates more down volume than up volume (bearish breadth).
Labels update every 10 bars and are anchored to the candle’s high (NYSE) and low (NASDAQ).
Negative ratios are inverted and displayed as -D:U to maintain a consistent “X:1” format.
Use this tool to assess whether institutional buying pressure is broad-based across exchanges — a valuable layer of confirmation for directional bias.
Open-source script
In true TradingView spirit, the creator of this script has made it open-source, so that traders can review and verify its functionality. Kudos to the author! While you can use it for free, remember that republishing the code is subject to our House Rules.
Disclaimer
The information and publications are not meant to be, and do not constitute, financial, investment, trading, or other types of advice or recommendations supplied or endorsed by TradingView. Read more in the Terms of Use.