OPEN-SOURCE SCRIPT
Updated London Session 15-min Range – Clean AEST Timestamp Fix (w/ EMAs)
London Session 15-min Range – Clean AEST Timestamp Fix (with EMAs)
What it does:
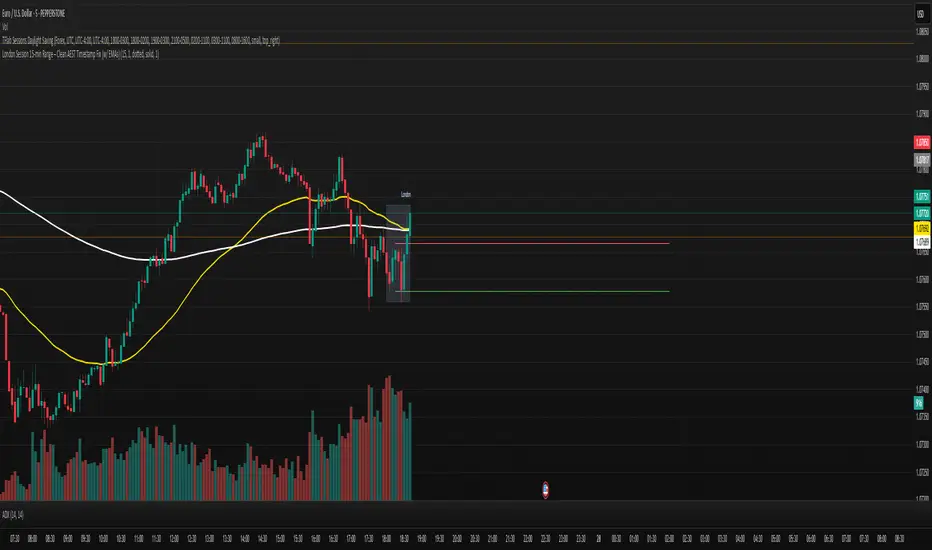
This script is made for traders who want to track the high and low of the first 15-minute candle of the London session, using AEST (UTC+10) as the time reference. It also plots the 50 EMA and 200 EMA to help identify trend direction.
How it works:
Session Timing:
Includes EMAs:
Why use it:
It helps visualise important price levels from the start of the London session and pairs that with moving averages to spot trends or potential breakouts.
What it does:
This script is made for traders who want to track the high and low of the first 15-minute candle of the London session, using AEST (UTC+10) as the time reference. It also plots the 50 EMA and 200 EMA to help identify trend direction.
How it works:
Session Timing:
- The London session is defined as starting at 6:00 PM AEST.
- The session ends at 2:00 AM AEST the next day.
- Detects the first 15 minutes of the London session:
- During this time, it records the highest and lowest price.
- Draws lines once the 15-minute window is over:
- A red horizontal line is drawn at the session high.
- A green horizontal line is drawn at the session low.
- These lines extend 50 bars into the future.
- It only draws these once per day/session.
Includes EMAs:
- A 50-period EMA is calculated and plotted in yellow.
- A 200-period EMA is calculated and plotted in white.
Why use it:
It helps visualise important price levels from the start of the London session and pairs that with moving averages to spot trends or potential breakouts.
Release Notes
London Session 15-min Range – Clean AEST Timestamp Fix (with EMAs)What it does:
This script is made for traders who want to track the high and low of the first 15-minute candle of the London session, using AEST (UTC+10) as the time reference. It also plots the 50 EMA and 200 EMA to help identify trend direction.
How it works:
Session Timing:
- The London session is defined as starting at 6:00 PM AEST.
- The session ends at 2:00 AM AEST the next day.
- Detects the first 15 minutes of the London session:
- During this time, it records the highest and lowest price.
- Draws lines once the 15-minute window is over:
- A red horizontal line is drawn at the session high.
- A green horizontal line is drawn at the session low.
- These lines extend 50 bars into the future.
- It only draws these once per day/session.
Includes EMAs:
A 50-period EMA is calculated and plotted in yellow.
A 200-period EMA is calculated and plotted in white.
Why use it:
It helps visualise important price levels from the start of the London session and pairs that with moving averages to spot trends or potential breakouts.
Release Notes
I’ve made a couple of upgrades to my London Session range indicator to make it more flexible and customisable:Line Extension Control
- Instead of hardcoding the session range lines to extend 30 bars forward, I’ve added a setting where I can choose how many bars the lines extend. The default is still 30 (which works well for the 15-minute chart), but I can adjust it to suit different timeframes or personal preference.
Editable Capture Window
- Originally, the script was locked to just the first 15 minutes of the London session. I’ve now made that adjustable too. I added a setting that lets me choose how many minutes I want to track the range for — whether it's 15, 20, 30 minutes, or even longer. This is great for tweaking the indicator based on how volatile the open is on any given day.
These changes make it more useful for testing, adapting to market conditions, or just tailoring the session range to fit my own trading style.
Release Notes
No need to chnage the line extension bars they are now dynamic based on the capture time frame - they will always now extend to the end of the London session.Release Notes
Added prevous day london high and lowRelease Notes
Made more options editableOpen-source script
In true TradingView spirit, the creator of this script has made it open-source, so that traders can review and verify its functionality. Kudos to the author! While you can use it for free, remember that republishing the code is subject to our House Rules.
Disclaimer
The information and publications are not meant to be, and do not constitute, financial, investment, trading, or other types of advice or recommendations supplied or endorsed by TradingView. Read more in the Terms of Use.
Open-source script
In true TradingView spirit, the creator of this script has made it open-source, so that traders can review and verify its functionality. Kudos to the author! While you can use it for free, remember that republishing the code is subject to our House Rules.
Disclaimer
The information and publications are not meant to be, and do not constitute, financial, investment, trading, or other types of advice or recommendations supplied or endorsed by TradingView. Read more in the Terms of Use.