OPEN-SOURCE SCRIPT
Prometheus Volatility EMA
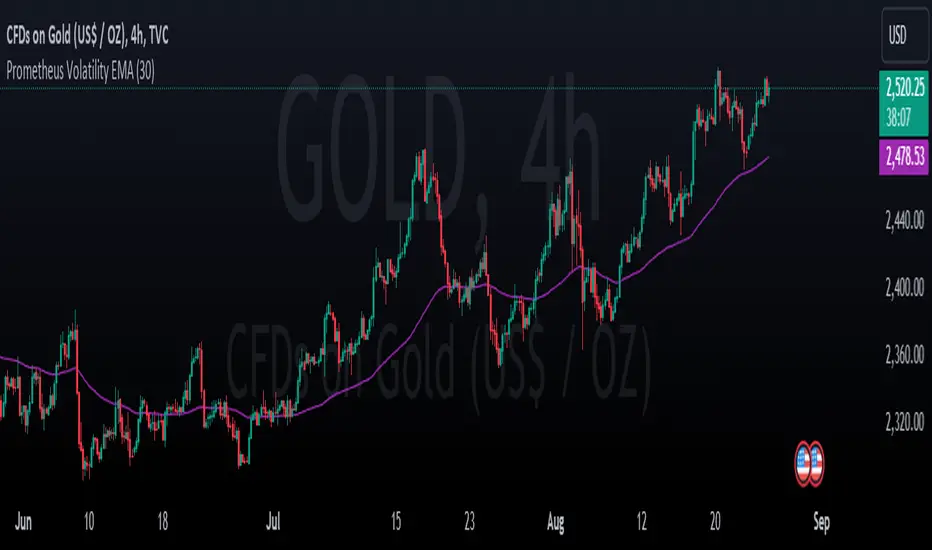
The Prometheus Volatility EMA is an indicator that calculates an Exponential Moving Average with the historical volatility as how we decide how sensitive to make the indicator to the most recent data.
A traditional EMA is calculated like this:
EMA = alpha * source + (1 - alpha) * EMA[1], where alpha = 2 / (length + 1)
Sourced from TradingView’s ta.ema built in function.
We see that the alpha value is used to determine how sensitive the EMA will be to the most recent prices, and it is derived from how many bars back are used in the calculation.
Prometheus is using the annualized historical volatility, for a specified period as the “alpha” value. The reason for this is that on more volatile assets, the EMA will follow price more closely to give you a better idea of when price may change direction.
Historical Volatility calculation:
Pine Script®
EMA calculation:
Pine Script®
Let's explain some charts to better understand this tool!

We see on a 1 year SHY chart, the moving average is far from the price. This makes sense as SHY has a range of 2.85% from the low to the high for this period in the photo above. It is not very volatile.

In this chart of BTCUSD we see that the EMA follows price very closely, way closer than it does on $SHY. This is because BTCUSD is much more volatile. BTCUSD has a range of 196% from the low to the high in this photo. Way more than $SHY.
We see it change on the same asset here looking at $QQQ. In the small period with the drop we see the EMA follow more closely as volatility picks up, then it quickly allows price to get far as volatility leaves.

This is the perspective we aim to provide. We encourage traders to not follow indicators blindly. No indicator is 100% accurate. This one can give you a different perspective of price strength with volatility. We encourage any comments about desired updates or criticism!
A traditional EMA is calculated like this:
EMA = alpha * source + (1 - alpha) * EMA[1], where alpha = 2 / (length + 1)
Sourced from TradingView’s ta.ema built in function.
We see that the alpha value is used to determine how sensitive the EMA will be to the most recent prices, and it is derived from how many bars back are used in the calculation.
Prometheus is using the annualized historical volatility, for a specified period as the “alpha” value. The reason for this is that on more volatile assets, the EMA will follow price more closely to give you a better idea of when price may change direction.
Historical Volatility calculation:
hv = ta.stdev(math.log(close / close[1]), lkb) * math.sqrt(252/5)
EMA calculation:
float hv_EMA = na
hv_EMA := na(hv_EMA[1]) ? ta.sma(close, lkb) : hv * close + (1 - hv) * hv_EMA[1]
Let's explain some charts to better understand this tool!
We see on a 1 year
In this chart of
We see it change on the same asset here looking at $QQQ. In the small period with the drop we see the EMA follow more closely as volatility picks up, then it quickly allows price to get far as volatility leaves.
This is the perspective we aim to provide. We encourage traders to not follow indicators blindly. No indicator is 100% accurate. This one can give you a different perspective of price strength with volatility. We encourage any comments about desired updates or criticism!
Open-source script
In true TradingView spirit, the creator of this script has made it open-source, so that traders can review and verify its functionality. Kudos to the author! While you can use it for free, remember that republishing the code is subject to our House Rules.
Disclaimer
The information and publications are not meant to be, and do not constitute, financial, investment, trading, or other types of advice or recommendations supplied or endorsed by TradingView. Read more in the Terms of Use.