OPEN-SOURCE SCRIPT
Updated Smart Moving Averages
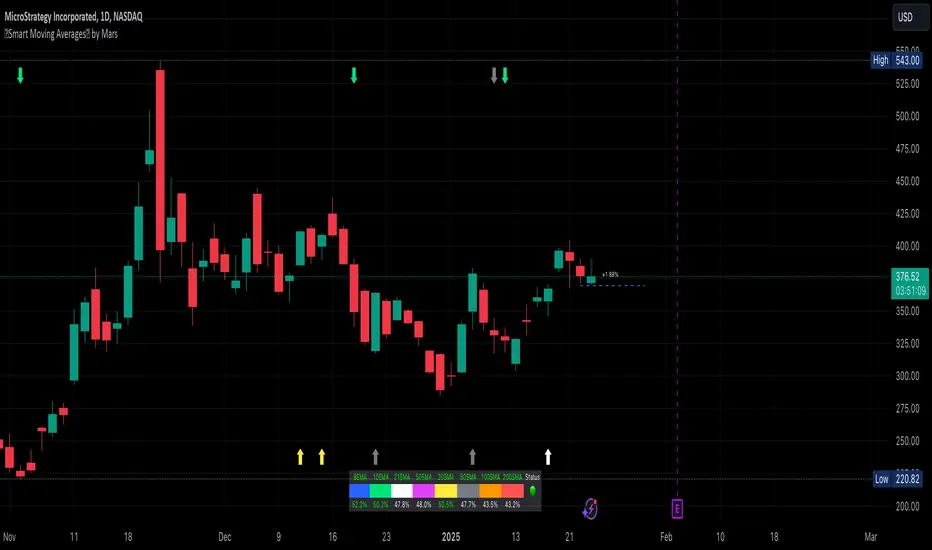
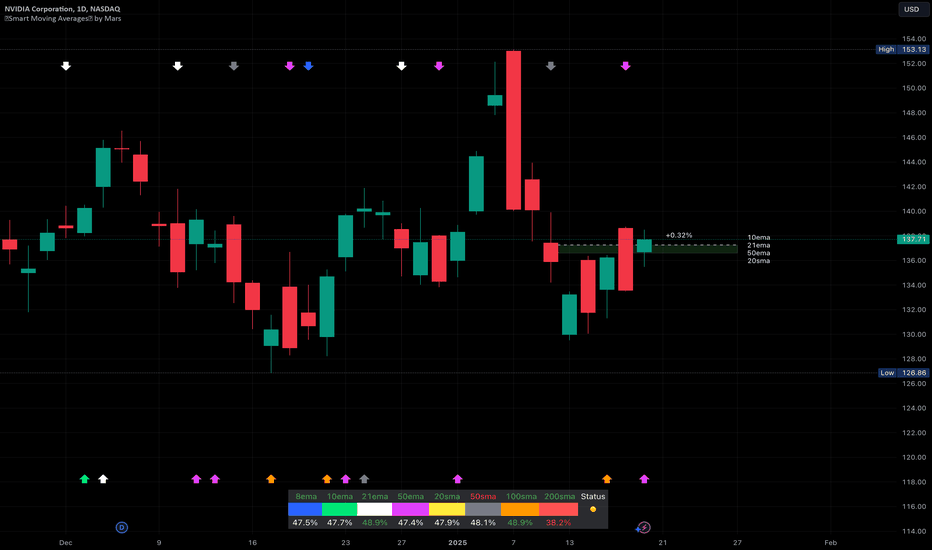
Smart Moving Averages analyzes the dynamic interplay between price action and multiple moving averages to identify high-probability support and resistance zones.
The script's distinguishing features include:
The script helps traders make more informed decisions by quantifying the historical reliability of different moving averages while providing real-time analysis of MA interactions with price. This systematic approach moves beyond simple MA crossovers to identify higher probability trading opportunities.
The script's distinguishing features include:
- Bounce detection that filters out noise by requiring specific penetration thresholds (0.1-1.5%), helping traders identify genuine support tests versus false signals
- Real-time MA clustering analysis that reveals zones where multiple moving averages converge, indicating potentially stronger support/resistance levels
- Statistical tracking of bounce success rates for each MA, allowing traders to identify which moving averages are most reliable for the current market conditions
- Power bounce detection that combines EMA spread analysis with trend confirmation, highlighting especially strong bullish setups
- Visual stack status system that instantly communicates market health through an intuitive color-coded display showing how many MAs are below price
The script helps traders make more informed decisions by quantifying the historical reliability of different moving averages while providing real-time analysis of MA interactions with price. This systematic approach moves beyond simple MA crossovers to identify higher probability trading opportunities.
Release Notes
Cluster transparency changes depending on the number of MAs in the cluster.Release Notes
cosmeticsRelease Notes
Why is this indicator useful and unique?- You won't need to add multiple moving averages to your chart and will be monitoring support on many moving averages at once. It also checks for clustering and adds a visual representation of them. Cluster of MAs equals stronger support, seen as a green area below price.
- It uses historical data to calculate the probability that a given moving average will support price
- It allows users to be notified on moving average bounces, which may be powerful entries
The video below describes it:
Release Notes
- 100SMA -> 150SMA (more useful)
- tooltip on status now contains distances to MAs
Release Notes
Fixed bug in the status indicator.Open-source script
In true TradingView spirit, the creator of this script has made it open-source, so that traders can review and verify its functionality. Kudos to the author! While you can use it for free, remember that republishing the code is subject to our House Rules.
Dad, trader, technologist, cyclist, and a modern stoic who loves dachshunds, espresso and landscape photography in no particular order.
Disclaimer
The information and publications are not meant to be, and do not constitute, financial, investment, trading, or other types of advice or recommendations supplied or endorsed by TradingView. Read more in the Terms of Use.
Open-source script
In true TradingView spirit, the creator of this script has made it open-source, so that traders can review and verify its functionality. Kudos to the author! While you can use it for free, remember that republishing the code is subject to our House Rules.
Dad, trader, technologist, cyclist, and a modern stoic who loves dachshunds, espresso and landscape photography in no particular order.
Disclaimer
The information and publications are not meant to be, and do not constitute, financial, investment, trading, or other types of advice or recommendations supplied or endorsed by TradingView. Read more in the Terms of Use.