OPEN-SOURCE SCRIPT
Risk Ladder
📝 Description:
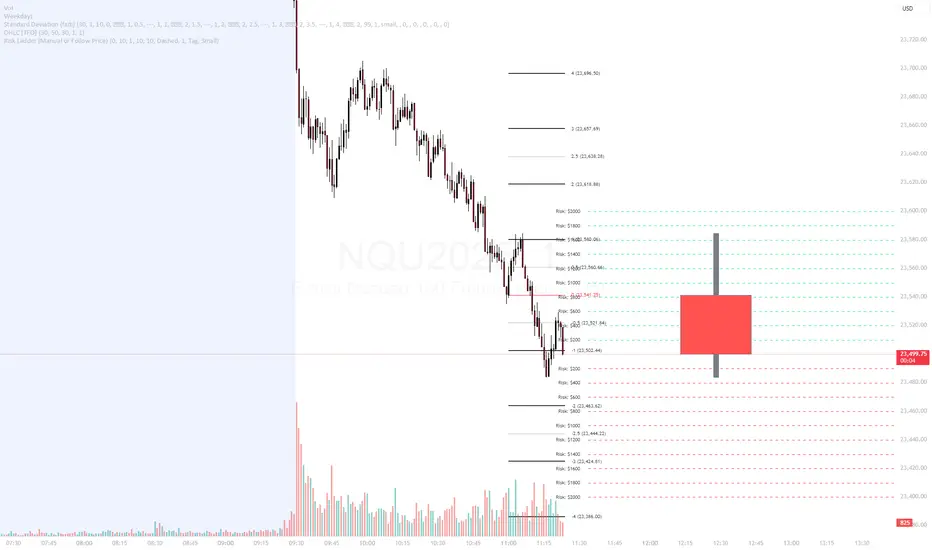
The Risk Ladder plots visual risk levels above and below a selected price, helping traders instantly assess risk exposure per contract across key price intervals.
This tool offers two modes:
✅ Live Mode – Automatically anchors to the current market price
✅ Manual Mode – Anchor the ladder to your custom trade entry price (e.g., after placing a position)
Each level displays the cumulative risk in dollars, calculated based on:
Contract size
Tick value for the symbol (auto-detected for ES, NQ, CL, etc.)
Distance from entry price
🎨 Fully Customizable:
Interval between levels (e.g. every 10 points)
Number of levels above/below
Line color, width, and style
Label size, shape (tag or box), color, and offset
Toggle between live or manual entry modes
💡 Use Cases:
Visualize risk tiers before or after entering a position
Define profit-taking and stop-loss zones based on risk multiples
Clean overlay to complement your price action, VWAP, or R:R strategy
🔁 How to Use:
Select whether to use manual entry or follow live price
Adjust your risk interval and contract size
Watch the ladder instantly reflect total risk every level
Open-source script
In true TradingView spirit, the creator of this script has made it open-source, so that traders can review and verify its functionality. Kudos to the author! While you can use it for free, remember that republishing the code is subject to our House Rules.
Disclaimer
The information and publications are not meant to be, and do not constitute, financial, investment, trading, or other types of advice or recommendations supplied or endorsed by TradingView. Read more in the Terms of Use.