OPEN-SOURCE SCRIPT
Ethereum Rainbow Chart (9 Levels with Legend)
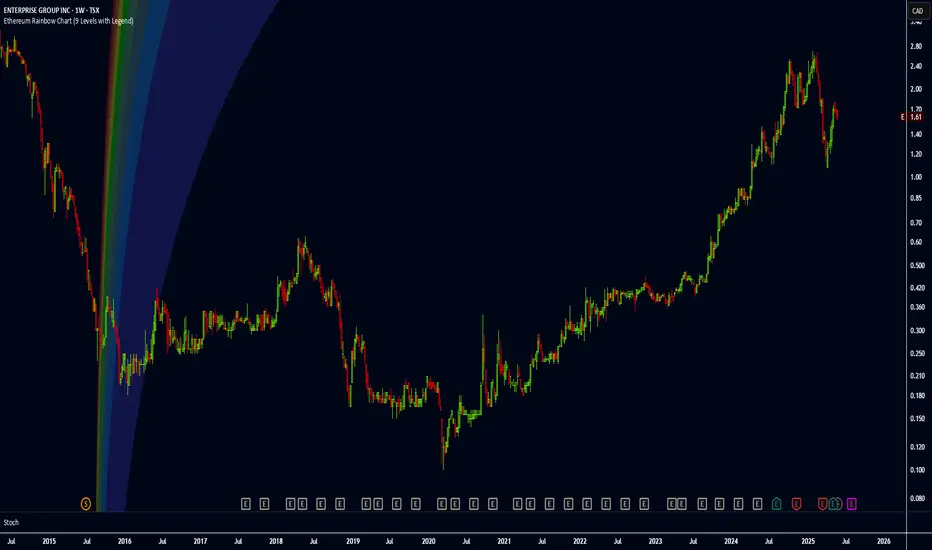
The Ethereum Rainbow Chart is a long-term, color-coded chart that displays Ethereum’s price on a logarithmic scale to show historical trends and growth patterns. It uses colored bands to highlight different price zones, helping to visualize how ETH’s price has moved over time without focusing on short-term fluctuations.
Open-source script
In true TradingView spirit, the creator of this script has made it open-source, so that traders can review and verify its functionality. Kudos to the author! While you can use it for free, remember that republishing the code is subject to our House Rules.
Disclaimer
The information and publications are not meant to be, and do not constitute, financial, investment, trading, or other types of advice or recommendations supplied or endorsed by TradingView. Read more in the Terms of Use.