OPEN-SOURCE SCRIPT
Ichimoku Cross
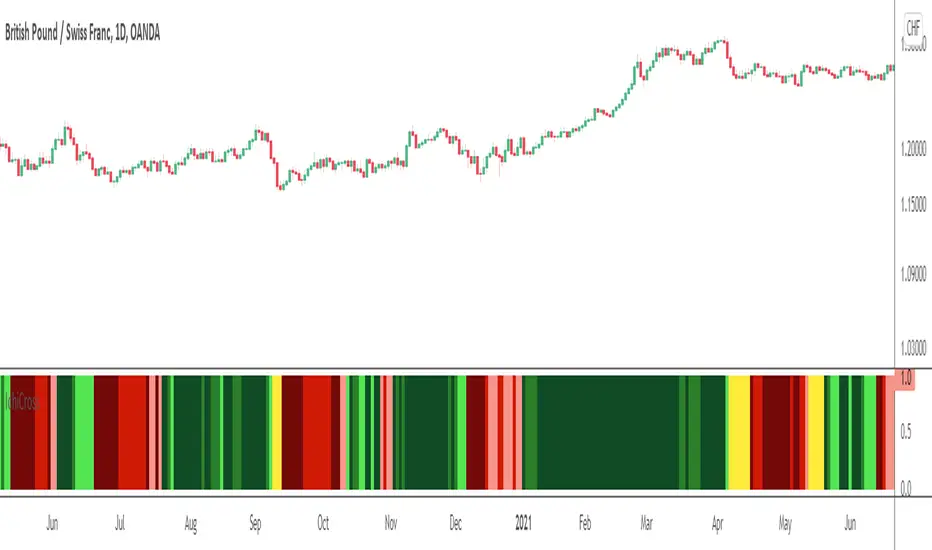
This is a trend analysis indicator based on Ichimoku
this indicator splits the chart into :
"Buy Phase" where KijunSen > TenkanSen with "Green color"
"Sell Phase" where KijunSen < TenkanSen with "Red color"
"Cross Phase" where KijunSen = TenkanSen
Close of each candle above or below KijunSen and TenkanSen determine the strength of the trend
and is shown by 3 different green colors for Bullish Trends and 3 different red colors for Bearish Trends .
Open-source script
In true TradingView spirit, the creator of this script has made it open-source, so that traders can review and verify its functionality. Kudos to the author! While you can use it for free, remember that republishing the code is subject to our House Rules.
Disclaimer
The information and publications are not meant to be, and do not constitute, financial, investment, trading, or other types of advice or recommendations supplied or endorsed by TradingView. Read more in the Terms of Use.