OPEN-SOURCE SCRIPT
Updated BB and Keltner Squeeze
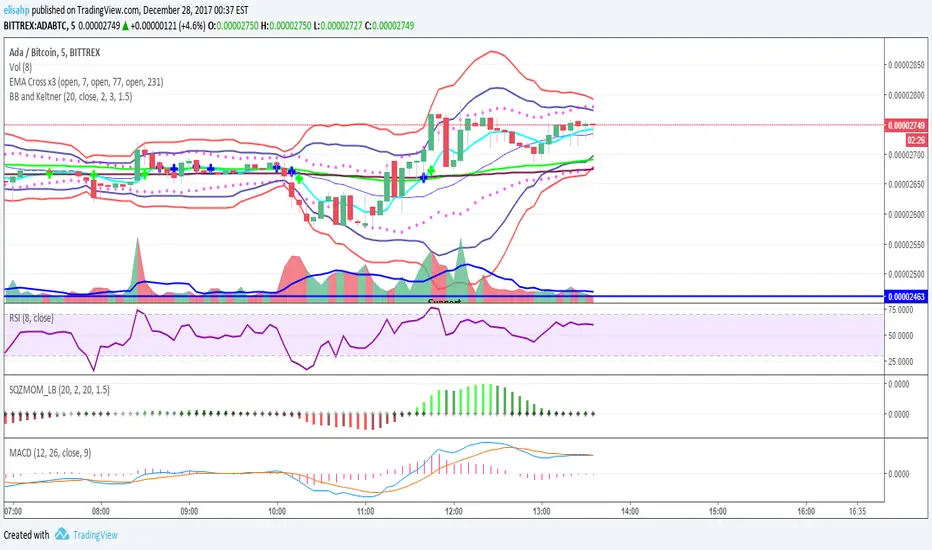
Strategy using the Bollinger band with the Keltner Channels . Watch for the Bollinger bands (blue/red lines) squeezing inside the Keltner Channels (pink dots) for a breakout - this could be up or down so use in conjunction with other indicators.
The blue band is the 2 standard deviation from price, the red is 3 standard deviations. With these, typically if the price bounces off the red then it will retrace a little, (although if there is a massive breakout/down this may not hold). When the bands narrow this is an indicator of consolidation, therefore with a likely upcoming breakup or down.
The pink dots are the Keltner Channels. The strategy says if the bollinger bands come inside the Keltner Channels then this is a strong indicator that the breakout is coming. Sometimes the length of time the squeeze occurs for is indicative of the length/strength of the breakout.
These indicators can be used on all timeframes but higher timeframes will be stronger and more reliable of a trend change.
Release Notes
New version - minor change to an incorrect title. No change to function of script.Strategy using the Bollinger band with the Keltner Channels . Watch for the Bollinger bands (blue/red lines) squeezing inside the Keltner Channels (pink dots) for a breakout - this could be up or down so use in conjunction with other indicators.
The blue band is the 2 standard deviation from price, the red is 3 standard deviations. With these, typically if the price bounces off the red then it will retrace a little, (although if there is a massive breakout/down this may not hold). When the bands narrow this is an indicator of consolidation, therefore with a likely upcoming breakup or down.
The pink dots are the Keltner Channels . The strategy says if the bollinger bands come inside the Keltner Channels then this is a strong indicator that the breakout is coming. Sometimes the length of time the squeeze occurs for is indicative of the length/strength of the breakout.
These indicators can be used on all timeframes but higher timeframes will be stronger and more reliable of a trend change.
Release Notes
Just cleaning up the chart so it can be seen better!Open-source script
In true TradingView spirit, the creator of this script has made it open-source, so that traders can review and verify its functionality. Kudos to the author! While you can use it for free, remember that republishing the code is subject to our House Rules.
Endless learning
Disclaimer
The information and publications are not meant to be, and do not constitute, financial, investment, trading, or other types of advice or recommendations supplied or endorsed by TradingView. Read more in the Terms of Use.
Open-source script
In true TradingView spirit, the creator of this script has made it open-source, so that traders can review and verify its functionality. Kudos to the author! While you can use it for free, remember that republishing the code is subject to our House Rules.
Endless learning
Disclaimer
The information and publications are not meant to be, and do not constitute, financial, investment, trading, or other types of advice or recommendations supplied or endorsed by TradingView. Read more in the Terms of Use.