OPEN-SOURCE SCRIPT
RSI Heart
Here's an introduction you can use for your RSI Heart indicator:
---
### RSI Heart Indicator
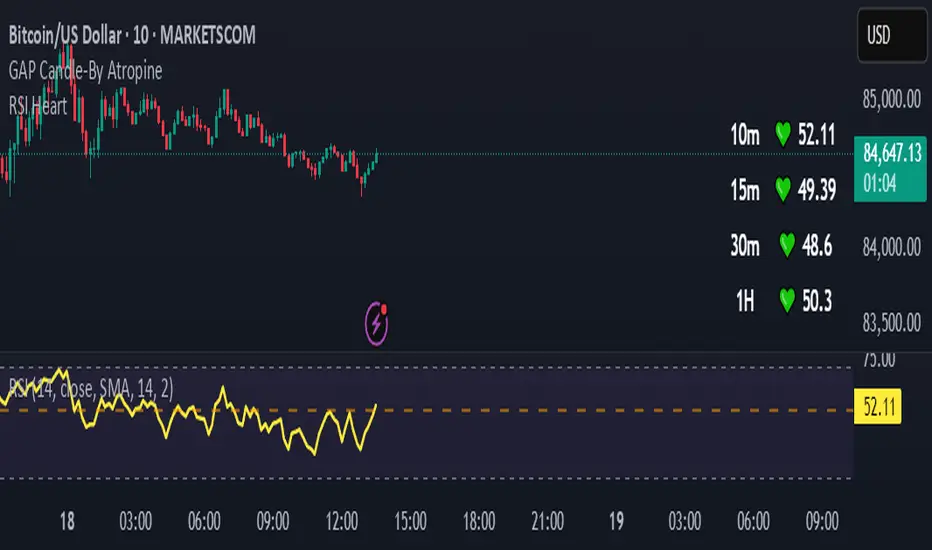
The **RSI Heart Indicator** provides a visually engaging way to monitor and track the **Relative Strength Index (RSI)** across multiple timeframes (10m, 15m, 30m, and 1H). It not only shows the RSI value but also uses heart-shaped symbols to reflect the current market condition based on RSI levels, making it easier to understand the strength and momentum of a given asset at a glance.
### Key Features:
- **Multi-Timeframe Support**: The indicator pulls the RSI values from multiple timeframes (10 minutes, 15 minutes, 30 minutes, and 1 hour) so you can analyze market strength at different intervals in one view.
- **Heart Symbols**: RSI values are displayed alongside heart emojis (❤️, 💛, 💚) that provide a visual cue for the market condition:
- **❤️ (Overbought or Oversold)**: When RSI is below 27 or above 73.
- **💛 (Near Oversold/Overbought)**: When RSI is between 27-30 or 70-73.
- **💚 (Neutral)**: When RSI is between 30 and 70.
- **Customizable Visibility**: Toggle visibility for each timeframe's RSI using simple on/off settings, giving you control over which timeframes are displayed in your chart.
### How it Can Help:
- **Quick Market Sentiment Analysis**: The heart symbols and RSI values allow you to quickly assess whether an asset is in an overbought or oversold condition.
- **Multi-Timeframe RSI**: By viewing RSI across multiple timeframes, you can gain a more comprehensive understanding of market momentum and strength.
- **Personalized to Your Preferences**: Adjust the settings to only show the timeframes that matter most to you, creating a customized and clean chart view.
This indicator helps traders make more informed decisions by providing a clear, easy-to-read representation of market conditions across various timeframes, all within one indicator.
---
This introduction explains what the indicator does, its features, and how it can benefit traders in a concise and easy-to-understand way.
---
### RSI Heart Indicator
The **RSI Heart Indicator** provides a visually engaging way to monitor and track the **Relative Strength Index (RSI)** across multiple timeframes (10m, 15m, 30m, and 1H). It not only shows the RSI value but also uses heart-shaped symbols to reflect the current market condition based on RSI levels, making it easier to understand the strength and momentum of a given asset at a glance.
### Key Features:
- **Multi-Timeframe Support**: The indicator pulls the RSI values from multiple timeframes (10 minutes, 15 minutes, 30 minutes, and 1 hour) so you can analyze market strength at different intervals in one view.
- **Heart Symbols**: RSI values are displayed alongside heart emojis (❤️, 💛, 💚) that provide a visual cue for the market condition:
- **❤️ (Overbought or Oversold)**: When RSI is below 27 or above 73.
- **💛 (Near Oversold/Overbought)**: When RSI is between 27-30 or 70-73.
- **💚 (Neutral)**: When RSI is between 30 and 70.
- **Customizable Visibility**: Toggle visibility for each timeframe's RSI using simple on/off settings, giving you control over which timeframes are displayed in your chart.
### How it Can Help:
- **Quick Market Sentiment Analysis**: The heart symbols and RSI values allow you to quickly assess whether an asset is in an overbought or oversold condition.
- **Multi-Timeframe RSI**: By viewing RSI across multiple timeframes, you can gain a more comprehensive understanding of market momentum and strength.
- **Personalized to Your Preferences**: Adjust the settings to only show the timeframes that matter most to you, creating a customized and clean chart view.
This indicator helps traders make more informed decisions by providing a clear, easy-to-read representation of market conditions across various timeframes, all within one indicator.
---
This introduction explains what the indicator does, its features, and how it can benefit traders in a concise and easy-to-understand way.
Open-source script
In true TradingView spirit, the creator of this script has made it open-source, so that traders can review and verify its functionality. Kudos to the author! While you can use it for free, remember that republishing the code is subject to our House Rules.
Disclaimer
The information and publications are not meant to be, and do not constitute, financial, investment, trading, or other types of advice or recommendations supplied or endorsed by TradingView. Read more in the Terms of Use.