OPEN-SOURCE SCRIPT
Renko Open Range 𝛥
Delta Renko-Style Indicator Guide (NQ Focus)
This indicator takes inspiration from the Renko Chart concept and is optimized for the RTH session (New York time zone), specifically applied to the Nasdaq futures (NQ) product.
If you’re unfamiliar with Renko charts, it may help to review their basics first, as this indicator borrows their clean, block-based perspective to simplify price interpretation.
⸻
🔧 How the Indicator Works
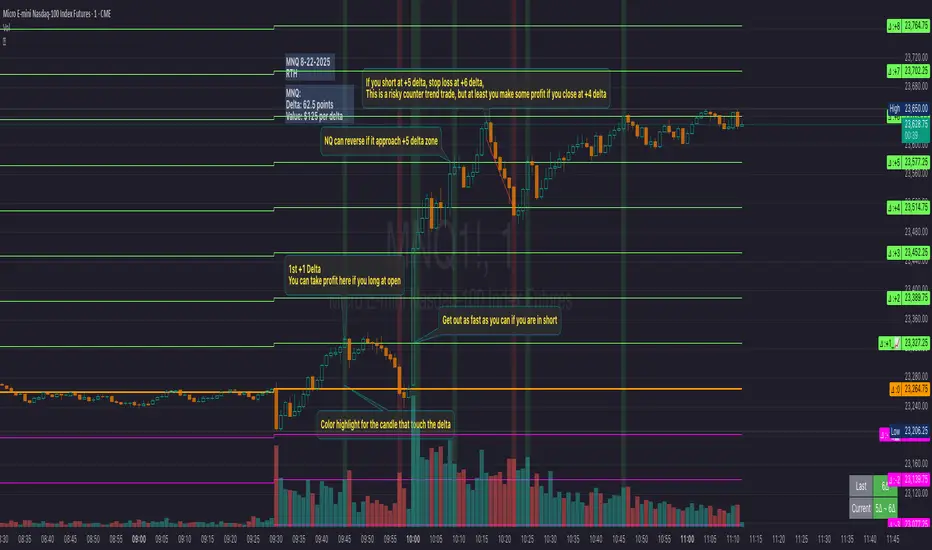
• At market open (9:30 AM EST), the indicator plots a horizontal open price line, referred to as 0 delta.
• From this anchor, it plots 10 incremental levels (deltas) both above and below the open, each spaced by 62.5 NQ points.
Why 62.5?
• With NQ currently trading in the 23,000–24,000 range, a 62.5-point move represents roughly 0.26% of the daily average range.
• This makes each delta step significant enough to capture movement while filtering out smaller noise.
A mini table (location adjustable) displays:
• Current delta zone
• Last touched delta level
This gives you a quick snapshot of where price sits relative to the open.
⸻
📈 How to Read the Market
• At the open, price typically oscillates between 0 and +1 / -1 delta.
• A break beyond this zone often signals stronger directional intent:
• Trending day: price can push into +2, +3, +4, +5 (or the inverse for downside).
• Range day: expect price to bounce between +1, 0, -1 deltas.
⚠️ Note: This is a visualization tool, not a trading system. Its purpose is to help you quickly recognize range vs. trend conditions.
⸻
📊 Example
• In this case, NQ reached +1 delta shortly after open.
• A retest of 0 delta followed, and price later surged to +5/+6 deltas (helped by Fed news).
⸻
🛠️ Practical Uses
This indicator can help you:
• Define profit targets
• Place hard stop levels
• Gauge whether a counter-trend trade is worth the risk
⚠️ Caution: Avoid counter-trend trades if price is aggressively pushing toward +5/+6 or -5/-6 deltas, as trend exhaustion usually hasn’t set in yet.
⸻
🔄 Adapting for ES (S&P Futures)
• On NQ, 62.5 points ≈ $1,250 per contract.
• For ES, this translates to 25 points.
• Since 1 NQ contract ≈ 2 ES contracts in dollar terms, an optimized ES delta step would be 12.5 points.
You may also experiment with different delta values (e.g., 50 or 31.25 for NQ) to align with your risk profile and trading style.
⸻
🧪 Extending Beyond NQ
You can experiment with applying this indicator to ES or even stocks, but non-futures assets may require additional calibration and testing.
⸻
✅ Bottom line: This tool provides a clean, Renko-inspired framework for quickly gauging trend vs. range conditions, setting realistic profit targets, and avoiding poor counter-trend setups.
Open-source script
In true TradingView spirit, the creator of this script has made it open-source, so that traders can review and verify its functionality. Kudos to the author! While you can use it for free, remember that republishing the code is subject to our House Rules.
Disclaimer
The information and publications are not meant to be, and do not constitute, financial, investment, trading, or other types of advice or recommendations supplied or endorsed by TradingView. Read more in the Terms of Use.