OPEN-SOURCE SCRIPT
Oculus Ultra Parallel S/R Channel
**Oculus Ultra Parallel S/R Channel**
*Version 1.0 | Pine Script v6*
**Overview**
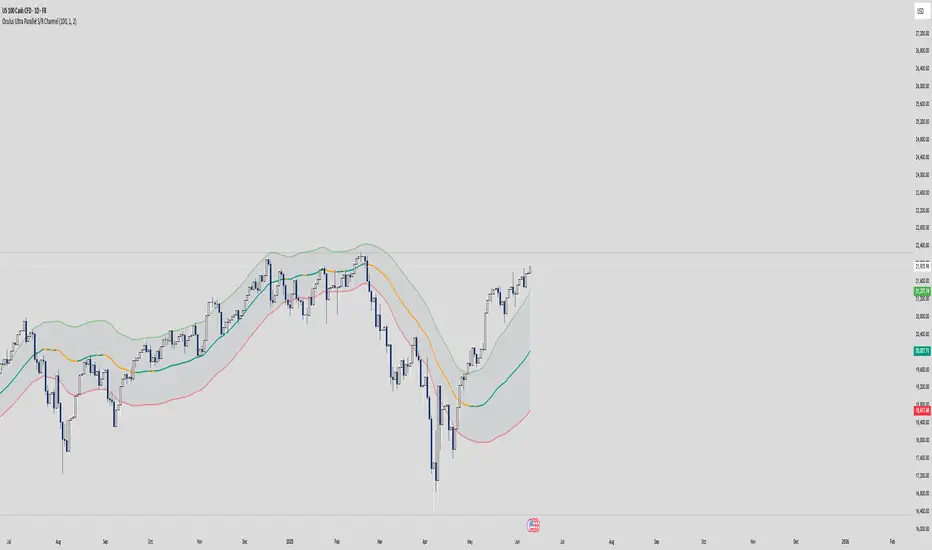
This indicator overlays a statistically-driven support/resistance channel on your chart by fitting a linear regression (median) line and plotting parallel bands at a configurable multiple of standard deviation. It adapts dynamically to both trend and volatility, highlights potential reaction zones, and offers optional alerts when price touches key levels.
**Key Features**
* **Median Regression Line**
Fits a best-fit line through the chosen lookback of price data, showing the underlying trend.
* **Volatility-Based Bands**
Upper and lower bands offset by *N*× standard deviation of regression residuals, capturing dynamic S/R zones.
* **Dynamic Coloring**
* Median line turns **teal** when sloping up, **orange** when sloping down.
* Bands tinted green or red depending on their position relative to the median.
* **Channel Fill**
Optional shaded area between the bands for immediate visual context.
* **Touch Alerts**
Precision alerts and on-chart markers when price touches the support or resistance band, with configurable tick tolerance.
* **Clean Layout**
Minimal lines and plots to avoid chart clutter, adjustable via toggle inputs.
**How to Use**
1. **Apply the Script** – Add to any timeframe in overlay mode.
2. **Configure Inputs** –
* **Channel Length**: Number of bars for regression and volatility calculation.
* **Deviation Factor**: Multiplier for band width (in standard deviations).
* **Show/Hide Elements**: Toggle median line, bands, fill, and touch alerts.
* **Color by Slope**: Enable slope-based median coloring.
* **Touch Tolerance**: Number of ticks within which a band touch is registered.
3. **Interpret the Channel** –
* **Trend**: Follow the slope and color of the median line.
* **Support/Resistance**: Bands represent dynamic zones where price often reacts.
* **Alerts**: Use touch markers or alert pop-ups to time entries or exits at band levels.
**Inputs**
* **Channel Length** (default: 100)
* **Deviation Factor** (default: 1.0)
* **Show Median Regression Line** (true/false)
* **Show Channel Bands** (true/false)
* **Fill Between Bands** (true/false)
* **Color Median by Slope** (true/false)
* **Alert on Band Touch** (true/false)
* **Touch Tolerance (ticks)** (default: 2)
**Version History**
* **1.0** – Initial release with dynamic regression channel, slope coloring, band fill, and touch alerts.
**Disclaimer**
This indicator is intended for educational purposes. Always backtest with your own settings and apply sound risk management before trading live.
*Version 1.0 | Pine Script v6*
**Overview**
This indicator overlays a statistically-driven support/resistance channel on your chart by fitting a linear regression (median) line and plotting parallel bands at a configurable multiple of standard deviation. It adapts dynamically to both trend and volatility, highlights potential reaction zones, and offers optional alerts when price touches key levels.
**Key Features**
* **Median Regression Line**
Fits a best-fit line through the chosen lookback of price data, showing the underlying trend.
* **Volatility-Based Bands**
Upper and lower bands offset by *N*× standard deviation of regression residuals, capturing dynamic S/R zones.
* **Dynamic Coloring**
* Median line turns **teal** when sloping up, **orange** when sloping down.
* Bands tinted green or red depending on their position relative to the median.
* **Channel Fill**
Optional shaded area between the bands for immediate visual context.
* **Touch Alerts**
Precision alerts and on-chart markers when price touches the support or resistance band, with configurable tick tolerance.
* **Clean Layout**
Minimal lines and plots to avoid chart clutter, adjustable via toggle inputs.
**How to Use**
1. **Apply the Script** – Add to any timeframe in overlay mode.
2. **Configure Inputs** –
* **Channel Length**: Number of bars for regression and volatility calculation.
* **Deviation Factor**: Multiplier for band width (in standard deviations).
* **Show/Hide Elements**: Toggle median line, bands, fill, and touch alerts.
* **Color by Slope**: Enable slope-based median coloring.
* **Touch Tolerance**: Number of ticks within which a band touch is registered.
3. **Interpret the Channel** –
* **Trend**: Follow the slope and color of the median line.
* **Support/Resistance**: Bands represent dynamic zones where price often reacts.
* **Alerts**: Use touch markers or alert pop-ups to time entries or exits at band levels.
**Inputs**
* **Channel Length** (default: 100)
* **Deviation Factor** (default: 1.0)
* **Show Median Regression Line** (true/false)
* **Show Channel Bands** (true/false)
* **Fill Between Bands** (true/false)
* **Color Median by Slope** (true/false)
* **Alert on Band Touch** (true/false)
* **Touch Tolerance (ticks)** (default: 2)
**Version History**
* **1.0** – Initial release with dynamic regression channel, slope coloring, band fill, and touch alerts.
**Disclaimer**
This indicator is intended for educational purposes. Always backtest with your own settings and apply sound risk management before trading live.
Open-source script
In true TradingView spirit, the creator of this script has made it open-source, so that traders can review and verify its functionality. Kudos to the author! While you can use it for free, remember that republishing the code is subject to our House Rules.
Disclaimer
The information and publications are not meant to be, and do not constitute, financial, investment, trading, or other types of advice or recommendations supplied or endorsed by TradingView. Read more in the Terms of Use.