OPEN-SOURCE SCRIPT
IFVG Extended
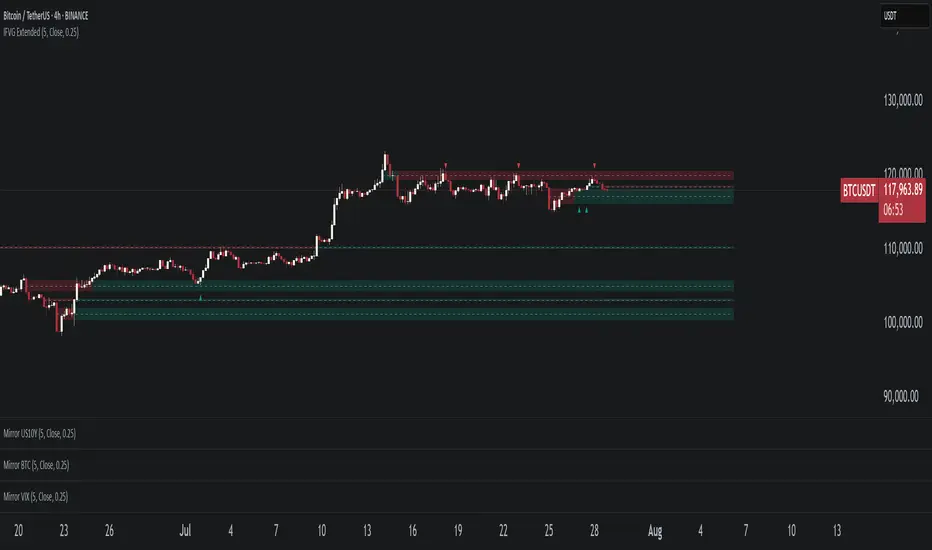
This indicator identifies and visualizes "Imbalance Fair Value Gaps" (IFVGs) on a price chart. It highlights these gaps, tracks their evolution, and signals when they are "filled" or "invalidated" by price action. The script is quite advanced, using custom types, arrays, and dynamic drawing.
1. Types and Variables
Custom Types:
lab: Stores label information (x, y, direction).
fvg: Stores Fair Value Gap data, including its boundaries, direction, state, labels, and other properties.
Arrays:
Four arrays track bullish and bearish FVGs, and their "invalidated" (filled) versions.
Signals:
Boolean variables to store if a bullish or bearish signal is triggered.
2. User Inputs and Parameters
Display Settings:
How many recent FVGs to show, signal preference (close or wick), ATR multiplier for gap size filtering, and colors for bullish/bearish/midline.
3. Chart Data
Price Data:
Open, high, low, close, and ATR (Average True Range) are stored for use in calculations.
4. Functions
label_maker:
Draws an up or down arrow label at a given point, colored for bullish or bearish.
fvg_manage:
Checks if any FVGs in the array have been "invalidated" (i.e., price has crossed their boundary). If so, moves them to the invalidated array.
inv_manage:
Manages invalidated FVGs, checking if a signal should be fired (i.e., price has reacted to the gap). Also removes old FVGs.
send_it:
Draws the FVGs and their labels on the chart, using boxes and lines for visualization.
5. Main Logic and Visualization
FVG Detection:
On each bar, checks for new bullish or bearish FVGs based on price action and ATR filter.
Adds new FVGs to the appropriate array.
FVG Management:
Updates the arrays, moves invalidated FVGs, and checks for signals.
Drawing:
On the last bar, clears all previous drawings and redraws the current FVGs and their labels.
6. Alerts
Alert Conditions:
Sets up alerts for when a bullish or bearish IFVG signal is triggered, so users can be notified.
Summary
In short:
This script automatically finds and tracks "Imbalance Fair Value Gaps" on your chart, highlights them, and alerts you when price interacts with them in a significant way. It uses advanced Pine Script features to manage and visualize these zones dynamically, helping traders spot potential reversal or continuation points based on gap theory
Open-source script
In true TradingView spirit, the creator of this script has made it open-source, so that traders can review and verify its functionality. Kudos to the author! While you can use it for free, remember that republishing the code is subject to our House Rules.
Disclaimer
The information and publications are not meant to be, and do not constitute, financial, investment, trading, or other types of advice or recommendations supplied or endorsed by TradingView. Read more in the Terms of Use.