OPEN-SOURCE SCRIPT
Colored Volume Bars with Standard Deviation from the Mean
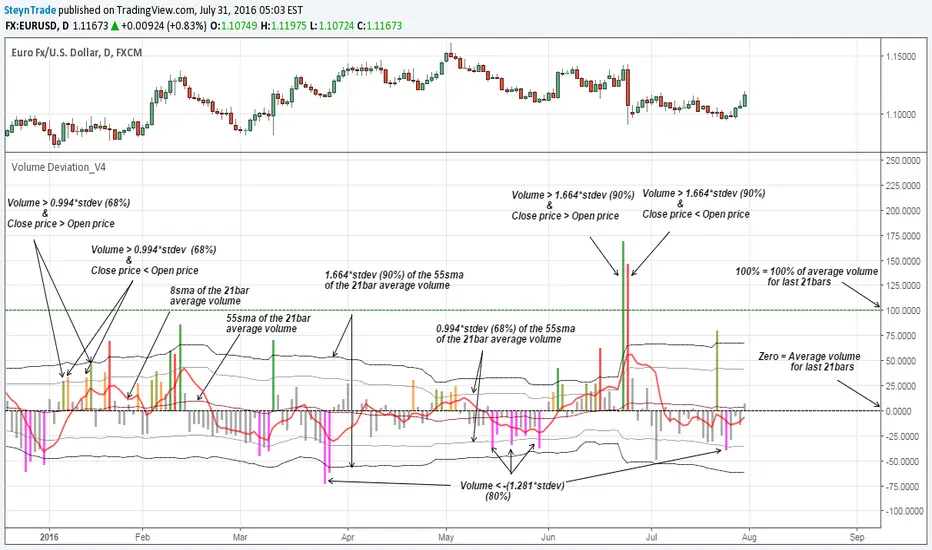
I have updated the indicator to help visualize volume . The percentage scale is based on a 21 period look back average . The colored volume bars represent volumes that exceed specified standard deviation of this 21 period average as indicated in the figure. The deviation bands are based on a the 55sma of the 21 period average (brown line). A 8 period sma of the 21 moving average (red line) is also indicated.
Open-source script
In true TradingView spirit, the creator of this script has made it open-source, so that traders can review and verify its functionality. Kudos to the author! While you can use it for free, remember that republishing the code is subject to our House Rules.
Disclaimer
The information and publications are not meant to be, and do not constitute, financial, investment, trading, or other types of advice or recommendations supplied or endorsed by TradingView. Read more in the Terms of Use.