OPEN-SOURCE SCRIPT
RSI - Made Easy
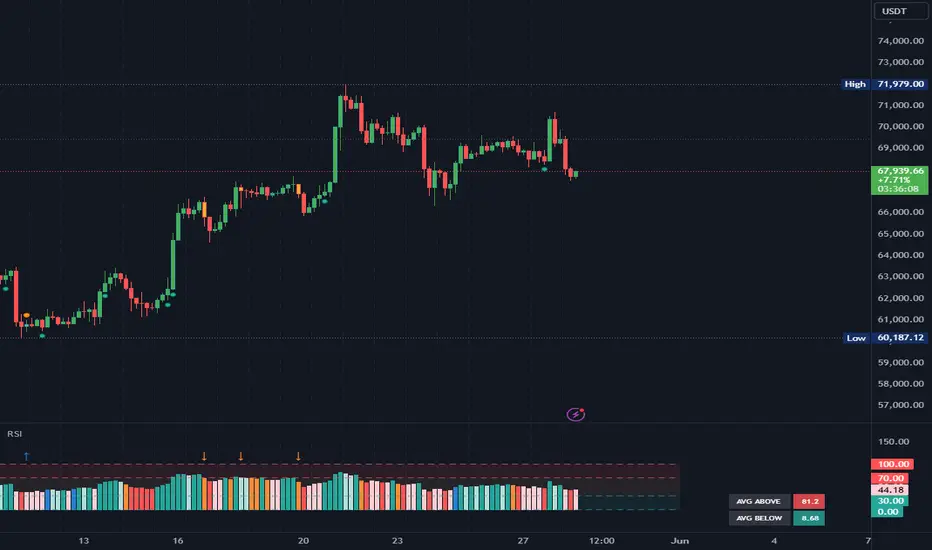
This indicator is a visually improved version of RSI. It makes it much easier to see what's happening by simplifying those confusing, intersecting lines. With this, you can detect the RSI direction more clearly. All the features are also explained in the tooltips of the input fields. Some extra features are included, such as average top and bottom calculation, standard deviation and divergences.
Color legend:
Color legend:
- Green: RSI Above MA and Rising
- Light Green: RSI Above MA and Falling
- Red: RSI Below MA and Falling
- Light Red: RSI Below MA and Rising
- Blue: RSI Crossover MA
- Orange: RSI Crossunder MA
- Blue Arrow: Bullish Divergence
- Orange Arrow: Bearish Divergence
Open-source script
In true TradingView spirit, the creator of this script has made it open-source, so that traders can review and verify its functionality. Kudos to the author! While you can use it for free, remember that republishing the code is subject to our House Rules.
Disclaimer
The information and publications are not meant to be, and do not constitute, financial, investment, trading, or other types of advice or recommendations supplied or endorsed by TradingView. Read more in the Terms of Use.