OPEN-SOURCE SCRIPT
RSI and MACD Divergence Indicator
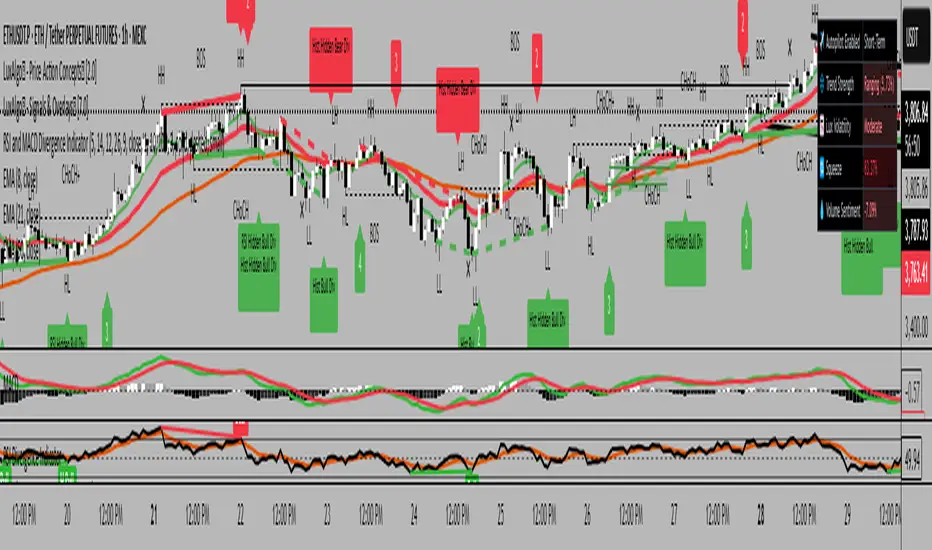
The RSI and MACD Divergence Indicator is a custom Pine Script v6 indicator designed for TradingView that identifies and visualizes divergences between price movements and two technical indicators: the Relative Strength Index (RSI) and the Moving Average Convergence Divergence (MACD). Here's a brief explanation of its functionality:
Divergence Detection: The indicator detects both regular and hidden divergences for RSI, MACD (MACD Line), and Histogram. Regular bullish divergences occur when price makes a lower low but the indicator makes a higher low (suggesting a potential reversal upward), while regular bearish divergences occur when price makes a higher high but the indicator makes a lower high (suggesting a potential reversal downward). Hidden divergences indicate continuation patterns (e.g., higher low in price with a lower low in the indicator for bullish continuation).
Customizable Inputs:
Pivot Bars: Sets the number of bars used to confirm pivot highs and lows (default: 5).
RSI and MACD Parameters: Allows adjustment of RSI length (default: 14) and MACD settings (fast: 12, slow: 26, signal: 9).
Toggle Options: Enables/disables detection of regular and hidden divergences for RSI, MACD, and Histogram individually.
Confirmation: Option to wait for pivot confirmation (default: true), delaying divergence display until the pivot is fully formed.
Show Only Last Divergence: Toggles between showing only the most recent divergence (default: true) or all detected divergences (false), with previous lines and labels cleared when true.
Minimum Divergences: Sets the minimum number of divergence types required at a pivot to display (default: 1, max: 6).
Maximum Pivot Points: Limits the number of historical pivot points to check (default: 10).
Maximum Bars to Check: Restricts analysis to the last specified number of bars (default: 500).
Visualization:
Draws lines connecting the price pivot points where divergences are detected, with customizable colors, widths, and styles (solid, dashed, dotted) for RSI and MACD.
Displays a single label per pivot with vertically stacked text listing all detected divergence types (e.g., "RSI Bull Div\nMACD Bull Div"), using semi-transparent backgrounds (green for bullish, red for bearish) and white text.
Open-source script
In true TradingView spirit, the creator of this script has made it open-source, so that traders can review and verify its functionality. Kudos to the author! While you can use it for free, remember that republishing the code is subject to our House Rules.
Disclaimer
The information and publications are not meant to be, and do not constitute, financial, investment, trading, or other types of advice or recommendations supplied or endorsed by TradingView. Read more in the Terms of Use.