OPEN-SOURCE SCRIPT
[HuD] Yearly High Low
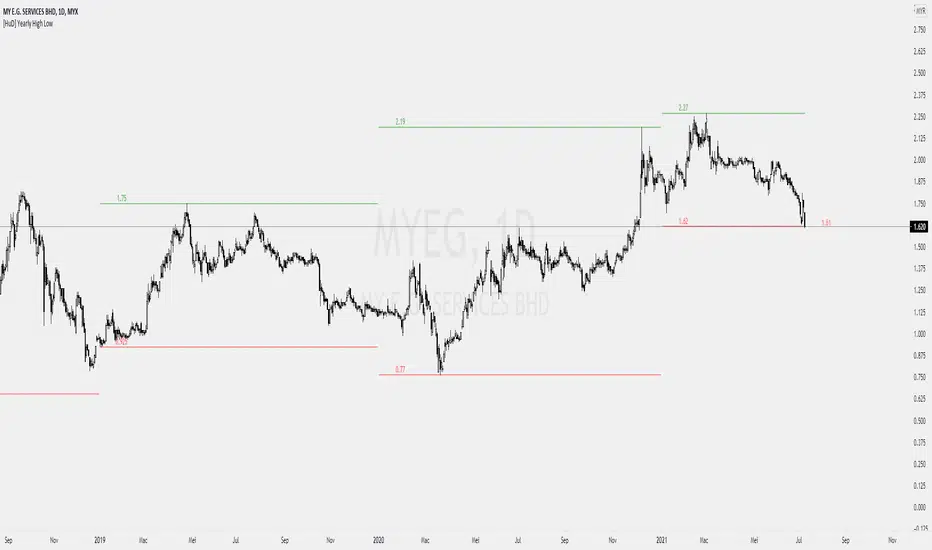
1. Indicator will display highest and lowest price level within yearly period.
- Highest Yearly Price = green line
- Lowest Yearly Price = red line
2. User also has an option to display Monthly high and low level.
- Monthly Highest Price = Blue Line
- Monthly Lowest Price = Orange Line
- Highest Yearly Price = green line
- Lowest Yearly Price = red line
2. User also has an option to display Monthly high and low level.
- Monthly Highest Price = Blue Line
- Monthly Lowest Price = Orange Line
Open-source script
In true TradingView spirit, the creator of this script has made it open-source, so that traders can review and verify its functionality. Kudos to the author! While you can use it for free, remember that republishing the code is subject to our House Rules.
Telegram : @HudHudAlert
Telegram Channel : t.me/HudHudAlert
TV Indicator : my.tradingview.com/u/Hud_Hud/
Telegram Channel : t.me/HudHudAlert
TV Indicator : my.tradingview.com/u/Hud_Hud/
Disclaimer
The information and publications are not meant to be, and do not constitute, financial, investment, trading, or other types of advice or recommendations supplied or endorsed by TradingView. Read more in the Terms of Use.