OPEN-SOURCE SCRIPT
Yelober_Momentum_BreadthMI
# Yelober_Momentum_BreadthMI: Market Breadth Indicator Analysis
## Overview
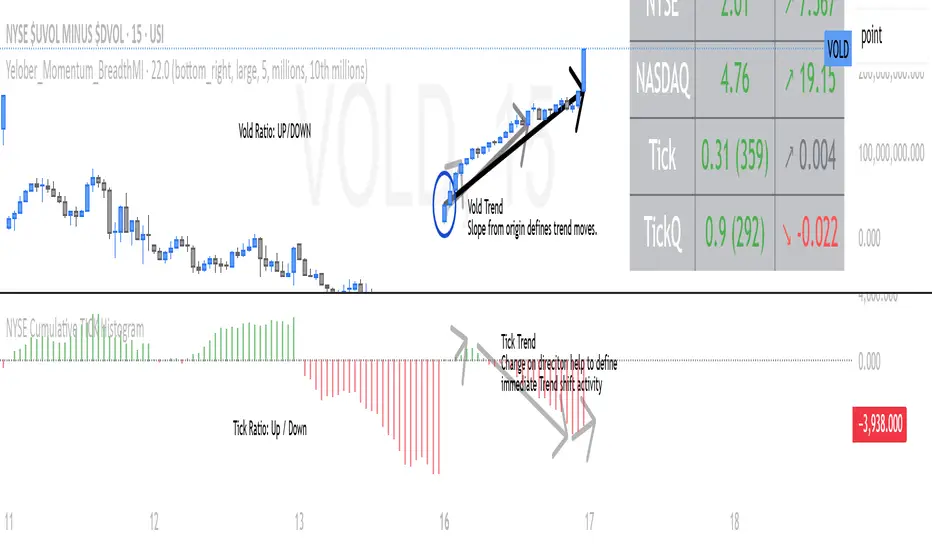
The Yelober_Momentum_BreadthMI is a comprehensive market breadth indicator designed to monitor market internals across NYSE and NASDAQ exchanges. It tracks several key metrics including up/down volume ratios, TICK readings, and trend momentum to provide traders with real-time insights into market direction, strength, and potential turning points.
## Indicator Components
This indicator displays a table with data for:
- NYSE breadth metrics
- NASDAQ breadth metrics
- NYSE TICK data and trends
- NASDAQ TICK (TICKQ) data and trends
## Table Columns and Interpretation
### Column 1: Market
Identifies the data source:
- **NYSE**: New York Stock Exchange data
- **NASDAQ**: NASDAQ exchange data
- **Tick**: NYSE TICK index
- **TickQ**: NASDAQ TICK index
### Column 2: Ratio
Shows the current ratio values with different calculations depending on the row:
- **For NYSE/NASDAQ rows**: Displays the up/down volume ratio
- Positive values (green): More up volume than down volume
- Negative values (red): More down volume than up volume
- The magnitude indicates the strength of the imbalance
- **For Tick/TickQ rows**: Shows the ratio of positive to negative ticks plus the current TICK reading in parentheses
- Format: "Ratio (Current TICK value)"
- Positive values (green): More stocks ticking up than down
- Negative values (red): More stocks ticking down than up
### Column 3: Trend
Displays the directional trend with both a symbol and value:
- **For NYSE/NASDAQ rows**: Shows the VOLD (volume difference) slope
- "↗": Rising trend (positive slope)
- "↘": Falling trend (negative slope)
- "→": Neutral/flat trend (minimal slope)
- **For Tick/TickQ rows**: Shows the slope of the ratio history
- Color-coding: Green for positive momentum, Red for negative momentum, Gray for neutral
The trend column is particularly important as it shows the current momentum of the market. The indicator applies specific thresholds for color-coding:
- NYSE: Green when normalized value > 2, Red when < -2
- NASDAQ: Green when normalized value > 3.5, Red when < -3.5
- TICK/TICKQ: Green when slope > 0.01, Red when slope < -0.01
## How to Use This Indicator
### Basic Interpretation
1. **Market Direction**: When multiple rows show green ratios and upward trends, it suggests strong bullish market internals. Conversely, red ratios and downward trends indicate bearish internals.
2. **Market Breadth**: The magnitude of the ratios indicates how broad-based the market movement is. Higher absolute values suggest stronger market breadth.
3. **Momentum Shifts**: When trend arrows change direction or colors shift, it may signal a potential reversal or change in market momentum.
4. **Divergences**: Look for divergences between different markets (NYSE vs NASDAQ) or between ratios and trends, which can indicate potential market turning points.
### Advanced Usage
- **Volume Normalization**: The indicator includes options to normalize volume data (none, tens, thousands, millions, 10th millions) to handle different exchange scales.
- **Trend Averaging**: The slope calculation uses an averaging period (default: 5) to smooth out noise and identify more reliable trend signals.
## Examples for Interpretation
### Example 1: Strong Bullish Market
```
| Market | Ratio | Trend |
|--------|---------|-----------|
| NYSE | 1.75 | ↗ 2.85 |
| NASDAQ | 2.10 | ↗ 4.12 |
| Tick | 2.45 (485) | ↗ 0.05 |
| TickQ | 1.95 (320) | ↗ 0.03 |
```
**Interpretation**: All metrics are positive and trending upward (green), indicating a strong, broad-based rally. The high ratio values show significant bullish dominance. This suggests continuation of the upward move with good momentum.
### Example 2: Weakening Market
```
| Market | Ratio | Trend |
|--------|---------|-----------|
| NYSE | 0.45 | ↘ -1.50 |
| NASDAQ | 0.85 | → 0.30 |
| Tick | 0.95 (105) | ↘ -0.02 |
| TickQ | 1.20 (160) | → 0.00 |
```
**Interpretation**: The market is showing mixed signals with positive but low ratios, while NYSE and TICK trends are turning negative. NASDAQ shows neutral to slightly positive momentum. This divergence often occurs near market tops or during consolidation phases. Traders should be cautious and consider reducing position sizes.
### Example 3: Negative Market Turning Positive
```
| Market | Ratio | Trend |
|--------|---------|-----------|
| NYSE | -1.25 | ↗ 1.75 |
| NASDAQ | -0.95 | ↗ 2.80 |
| Tick | -1.35 (-250) | ↗ 0.04 |
| TickQ | -1.10 (-180) | ↗ 0.02 |
```
**Interpretation**: This is a potential bottoming pattern. Current ratios are still negative (red) showing overall negative breadth, but the trends are all positive (green arrows), indicating improving momentum. This divergence often occurs at market bottoms and could signal an upcoming reversal. Look for confirmation with price action before establishing long positions.
### Example 4: Mixed Market with Divergence
```
| Market | Ratio | Trend |
|--------|---------|-----------|
| NYSE | 1.45 | ↘ -2.25 |
| NASDAQ | -0.85 | ↘ -3.80 |
| Tick | 1.20 (230) | ↘ -0.03 |
| TickQ | -0.75 (-120) | ↘ -0.02 |
```
**Interpretation**: There's a significant divergence between NYSE (positive ratio) and NASDAQ (negative ratio), while all trends are negative. This suggests sector rotation or a market that's weakening but with certain segments still showing strength. Often seen during late-stage bull markets or in transitions between leadership groups. Consider reducing risk exposure and focusing on relative strength sectors.
## Practical Trading Applications
1. **Confirmation Tool**: Use this indicator to confirm price movements. Strong breadth readings in the direction of the price trend increase confidence in trade decisions.
2. **Early Warning System**: Watch for divergences between price and breadth metrics, which often precede market turns.
3. **Intraday Trading**: The real-time nature of TICK and volume data makes this indicator valuable for day traders to gauge intraday momentum shifts.
4. **Market Regime Identification**: Sustained readings can help identify whether the market is in a trend or chop regime, allowing for appropriate strategy selection.
This breadth indicator is most effective when used in conjunction with price action and other technical indicators rather than in isolation.
## Overview
The Yelober_Momentum_BreadthMI is a comprehensive market breadth indicator designed to monitor market internals across NYSE and NASDAQ exchanges. It tracks several key metrics including up/down volume ratios, TICK readings, and trend momentum to provide traders with real-time insights into market direction, strength, and potential turning points.
## Indicator Components
This indicator displays a table with data for:
- NYSE breadth metrics
- NASDAQ breadth metrics
- NYSE TICK data and trends
- NASDAQ TICK (TICKQ) data and trends
## Table Columns and Interpretation
### Column 1: Market
Identifies the data source:
- **NYSE**: New York Stock Exchange data
- **NASDAQ**: NASDAQ exchange data
- **Tick**: NYSE TICK index
- **TickQ**: NASDAQ TICK index
### Column 2: Ratio
Shows the current ratio values with different calculations depending on the row:
- **For NYSE/NASDAQ rows**: Displays the up/down volume ratio
- Positive values (green): More up volume than down volume
- Negative values (red): More down volume than up volume
- The magnitude indicates the strength of the imbalance
- **For Tick/TickQ rows**: Shows the ratio of positive to negative ticks plus the current TICK reading in parentheses
- Format: "Ratio (Current TICK value)"
- Positive values (green): More stocks ticking up than down
- Negative values (red): More stocks ticking down than up
### Column 3: Trend
Displays the directional trend with both a symbol and value:
- **For NYSE/NASDAQ rows**: Shows the VOLD (volume difference) slope
- "↗": Rising trend (positive slope)
- "↘": Falling trend (negative slope)
- "→": Neutral/flat trend (minimal slope)
- **For Tick/TickQ rows**: Shows the slope of the ratio history
- Color-coding: Green for positive momentum, Red for negative momentum, Gray for neutral
The trend column is particularly important as it shows the current momentum of the market. The indicator applies specific thresholds for color-coding:
- NYSE: Green when normalized value > 2, Red when < -2
- NASDAQ: Green when normalized value > 3.5, Red when < -3.5
- TICK/TICKQ: Green when slope > 0.01, Red when slope < -0.01
## How to Use This Indicator
### Basic Interpretation
1. **Market Direction**: When multiple rows show green ratios and upward trends, it suggests strong bullish market internals. Conversely, red ratios and downward trends indicate bearish internals.
2. **Market Breadth**: The magnitude of the ratios indicates how broad-based the market movement is. Higher absolute values suggest stronger market breadth.
3. **Momentum Shifts**: When trend arrows change direction or colors shift, it may signal a potential reversal or change in market momentum.
4. **Divergences**: Look for divergences between different markets (NYSE vs NASDAQ) or between ratios and trends, which can indicate potential market turning points.
### Advanced Usage
- **Volume Normalization**: The indicator includes options to normalize volume data (none, tens, thousands, millions, 10th millions) to handle different exchange scales.
- **Trend Averaging**: The slope calculation uses an averaging period (default: 5) to smooth out noise and identify more reliable trend signals.
## Examples for Interpretation
### Example 1: Strong Bullish Market
```
| Market | Ratio | Trend |
|--------|---------|-----------|
| NYSE | 1.75 | ↗ 2.85 |
| NASDAQ | 2.10 | ↗ 4.12 |
| Tick | 2.45 (485) | ↗ 0.05 |
| TickQ | 1.95 (320) | ↗ 0.03 |
```
**Interpretation**: All metrics are positive and trending upward (green), indicating a strong, broad-based rally. The high ratio values show significant bullish dominance. This suggests continuation of the upward move with good momentum.
### Example 2: Weakening Market
```
| Market | Ratio | Trend |
|--------|---------|-----------|
| NYSE | 0.45 | ↘ -1.50 |
| NASDAQ | 0.85 | → 0.30 |
| Tick | 0.95 (105) | ↘ -0.02 |
| TickQ | 1.20 (160) | → 0.00 |
```
**Interpretation**: The market is showing mixed signals with positive but low ratios, while NYSE and TICK trends are turning negative. NASDAQ shows neutral to slightly positive momentum. This divergence often occurs near market tops or during consolidation phases. Traders should be cautious and consider reducing position sizes.
### Example 3: Negative Market Turning Positive
```
| Market | Ratio | Trend |
|--------|---------|-----------|
| NYSE | -1.25 | ↗ 1.75 |
| NASDAQ | -0.95 | ↗ 2.80 |
| Tick | -1.35 (-250) | ↗ 0.04 |
| TickQ | -1.10 (-180) | ↗ 0.02 |
```
**Interpretation**: This is a potential bottoming pattern. Current ratios are still negative (red) showing overall negative breadth, but the trends are all positive (green arrows), indicating improving momentum. This divergence often occurs at market bottoms and could signal an upcoming reversal. Look for confirmation with price action before establishing long positions.
### Example 4: Mixed Market with Divergence
```
| Market | Ratio | Trend |
|--------|---------|-----------|
| NYSE | 1.45 | ↘ -2.25 |
| NASDAQ | -0.85 | ↘ -3.80 |
| Tick | 1.20 (230) | ↘ -0.03 |
| TickQ | -0.75 (-120) | ↘ -0.02 |
```
**Interpretation**: There's a significant divergence between NYSE (positive ratio) and NASDAQ (negative ratio), while all trends are negative. This suggests sector rotation or a market that's weakening but with certain segments still showing strength. Often seen during late-stage bull markets or in transitions between leadership groups. Consider reducing risk exposure and focusing on relative strength sectors.
## Practical Trading Applications
1. **Confirmation Tool**: Use this indicator to confirm price movements. Strong breadth readings in the direction of the price trend increase confidence in trade decisions.
2. **Early Warning System**: Watch for divergences between price and breadth metrics, which often precede market turns.
3. **Intraday Trading**: The real-time nature of TICK and volume data makes this indicator valuable for day traders to gauge intraday momentum shifts.
4. **Market Regime Identification**: Sustained readings can help identify whether the market is in a trend or chop regime, allowing for appropriate strategy selection.
This breadth indicator is most effective when used in conjunction with price action and other technical indicators rather than in isolation.
Open-source script
In true TradingView spirit, the creator of this script has made it open-source, so that traders can review and verify its functionality. Kudos to the author! While you can use it for free, remember that republishing the code is subject to our House Rules.
Disclaimer
The information and publications are not meant to be, and do not constitute, financial, investment, trading, or other types of advice or recommendations supplied or endorsed by TradingView. Read more in the Terms of Use.