OPEN-SOURCE SCRIPT
Updated Weekly OHLC Levels
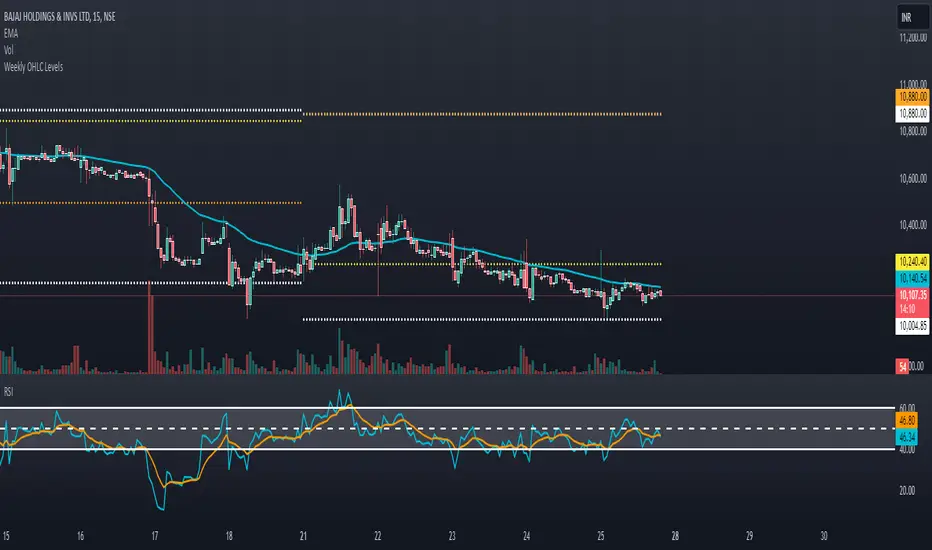
Weekly OHLC Levels Indicator
This indicator plots the previous week's open, high, low, and close (OHLC) levels on the chart for the entire duration of the current week. These levels can be critical for identifying key support and resistance zones, as they often represent psychological levels that traders watch closely.
Features:
Plots previous week’s High (green), Low (red), Open (blue), and Close (purple).
Levels remain visible throughout the current week, providing consistent reference points.
Helps in visualizing how current price action interacts with last week’s important levels.
How to Use:
Use these levels to gauge potential support and resistance areas.
Monitor price reactions around these levels, especially during the beginning of the week, as they can serve as pivot points.
This indicator is suitable for all markets and timeframes, providing valuable insight into price structure relative to weekly market behavior.
Release Notes
Weekly OHLC Levels IndicatorThis indicator plots the previous week's open, high, low, and close (OHLC) levels on the chart for the entire duration of the current week. These levels can be critical for identifying key support and resistance zones, as they often represent psychological levels that traders watch closely.
Features:
Plots previous week’s High (green), Low (red), Open (blue), and Close (purple).
Levels remain visible throughout the current week, providing consistent reference points.
Helps in visualizing how current price action interacts with last week’s important levels.
How to Use:
Use these levels to gauge potential support and resistance areas.
Monitor price reactions around these levels, especially during the beginning of the week, as they can serve as pivot points.
This indicator is suitable for all markets and timeframes, providing valuable insight into price structure relative to weekly market behavior.
Open-source script
In true TradingView spirit, the creator of this script has made it open-source, so that traders can review and verify its functionality. Kudos to the author! While you can use it for free, remember that republishing the code is subject to our House Rules.
Disclaimer
The information and publications are not meant to be, and do not constitute, financial, investment, trading, or other types of advice or recommendations supplied or endorsed by TradingView. Read more in the Terms of Use.