OPEN-SOURCE SCRIPT
Updated Stock Value EU
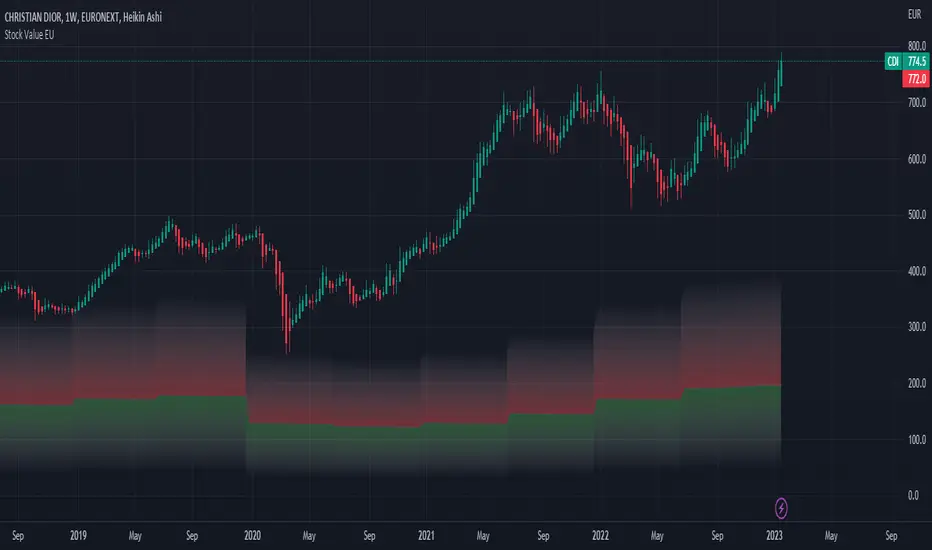
There are many method of measuring value of stock. However I'm proposing most basic stock valuation based on Book Value, Earnings , Dividends and Money Supply:
SV = (BVPS + EPS + DPS ) * ( M3 /M1)
BVPS = Book Value Per Share (Asset - Liability)
EPS = Earnings Per Share
DPS = Dividends Per Share
M3 = M3 Money Supply (Money Market)
M1 = M1 Money Supply (Base Money)
Fundamental value of a stock should be determine by it's BV which means total asset of a company if were liquidated today and use some of it's asset to pay of the debt. So technically BVPS is the intrinsic value of a stock. However the company is generating an earning which is profit and loss that should be added on top of the fundamental value of company, so thus EPS should be added on top of Book Value Per Share. Aside from earnings , the stock that you purchase give you dividends as your return so DPS also can be included on top of that. So all in all BVPS, EPS and DPS are the primary valuation of the stock. However most of the stock are traded way higher than their fundamental valuation. The main reason of this is the market dynamics which is driven by central banks printing of base money supply M0. The banking credit system then lend out this money to money markets as loan so that peoples can invest and by the company stock. This money supply extension of credit is known as money market M2 which drive the stock inflated price. The ratio between M2 and M0 are the money multiplier effect that drives the stock price higher than it's valuation. So the Stock Value should be the total number of BVPS + EPS + DPS times the M2 money multiplier as shown by this indicator.
If the stock are traded above their SV value, that means it's an overpriced bubble
If the stock are traded below their SV value, that means it's an underpriced burst
This indicator is only applicable for EU based stock chart, because we use EU money supply to do the money multiplier calculation. For other country stocks take a look our other indicator:
- Stock Value EU - applicable for European stocks
- Stock Value CN - applicable for Chinese stocks
- Valuation Rainbow - applicable for all countries
Release Notes
Add Gradient ColoringRelease Notes
Update GradientRelease Notes
Include free cash flow per share in the valuation logicCheck other script to value stock and index:
- Stock Value Rainbow: script to value stock based on book value, earning, dividend and cash flow
- Index Value Rainbow: script to value index based on fed balance sheet and base money supply
- Gold Value Rainbow: script to value gold based on global money supply
- Stock Value US: script to check US stock value
- Stock Value EU: script to check EU stock value
- Stock Value JP: script to check JP stock value
- Stock Value CN: script to check CN stock value
Open-source script
In true TradingView spirit, the creator of this script has made it open-source, so that traders can review and verify its functionality. Kudos to the author! While you can use it for free, remember that republishing the code is subject to our House Rules.
Disclaimer
The information and publications are not meant to be, and do not constitute, financial, investment, trading, or other types of advice or recommendations supplied or endorsed by TradingView. Read more in the Terms of Use.